OPEN-SOURCE SCRIPT
Squeeze Momentum Indicator
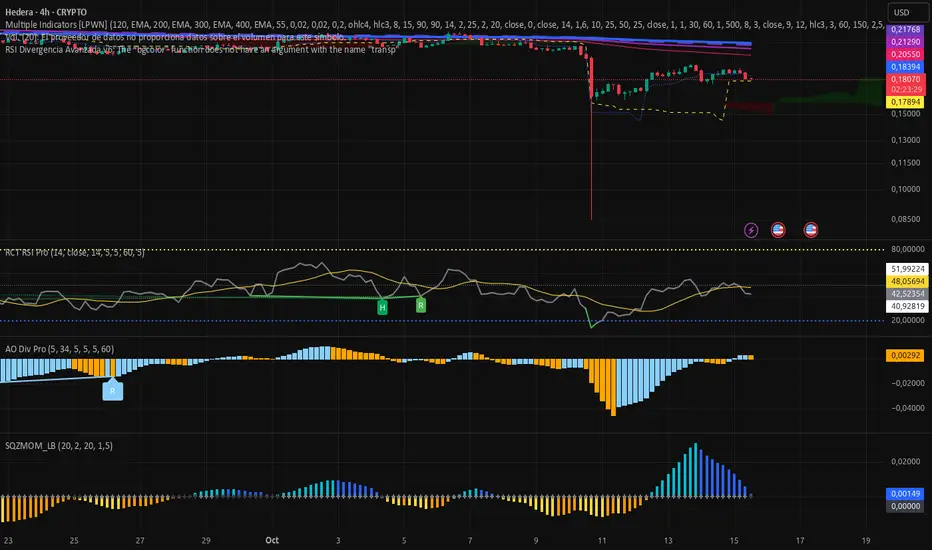
This indicator identifies periods of low market volatility—commonly referred to as a "squeeze"—by comparing Bollinger Bands and Keltner Channels. When volatility compresses, price often prepares for a directional breakout. The histogram visualizes momentum strength and direction once the squeeze ends.
**How it works:**
- **Squeeze detection**: A squeeze is active when Bollinger Bands are fully contained within Keltner Channels. This appears as black crosses on the zero line.
- **Volatility expansion**: When Bollinger Bands move outside Keltner Channels, volatility is increasing. This state is marked with blue crosses.
- **Momentum histogram**: The core signal is a linear regression of price relative to a dynamic baseline (average of the highest high, lowest low, and SMA over the lookback period).
- **Aqua**: Positive momentum that is accelerating.
- **Bright blue**: Positive momentum that is decelerating.
- **Yellow**: Negative momentum that is accelerating downward.
- **Orange**: Negative momentum that is decelerating (potential reversal zone).
**Usage notes:**
Traders often monitor the transition from squeeze (black) to expansion (blue) combined with a strong histogram move away from zero as a potential entry signal. Color changes in the histogram help assess momentum shifts before price makes large moves.
This script is designed for educational and analytical purposes. It does not constitute investment advice. Always test strategies in a simulated environment before applying them to live trading.
Mã nguồn mở
Theo đúng tinh thần TradingView, người tạo ra tập lệnh này đã biến tập lệnh thành mã nguồn mở để các nhà giao dịch có thể xem xét và xác minh công năng. Xin dành lời khen tặng cho tác giả! Mặc dù bạn có thể sử dụng miễn phí, nhưng lưu ý nếu đăng lại mã, bạn phải tuân theo Quy tắc nội bộ của chúng tôi.
Thông báo miễn trừ trách nhiệm
Thông tin và ấn phẩm không có nghĩa là và không cấu thành, tài chính, đầu tư, kinh doanh, hoặc các loại lời khuyên hoặc khuyến nghị khác được cung cấp hoặc xác nhận bởi TradingView. Đọc thêm trong Điều khoản sử dụng.