OPEN-SOURCE SCRIPT
Cập nhật Candle Thermals

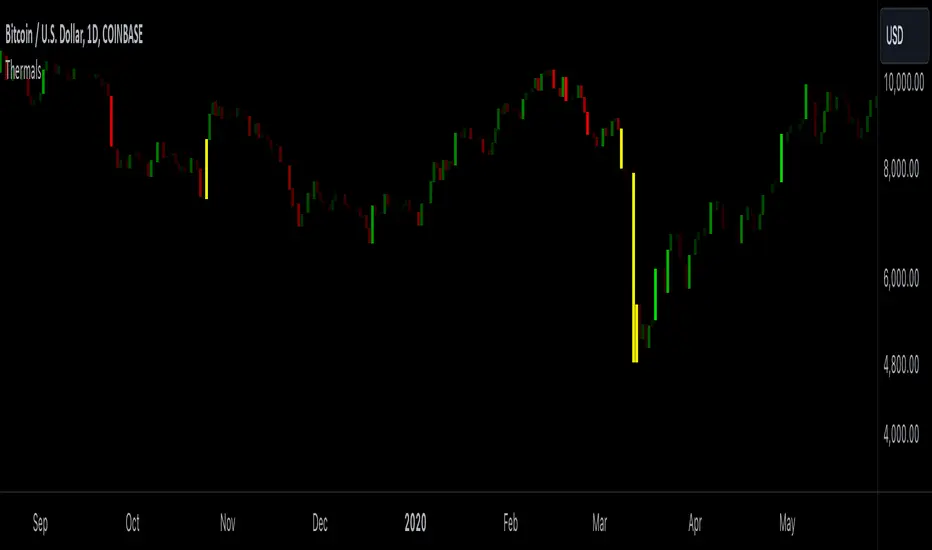
This indicator color candles based on their percentage price change, relative to the average, maximum, and minimum changes over the last 100 candles.
-It calculates the percentage change of all candles
-Calculates the minimum, maximum and average in the last 100 bars in percentage change
-Changes color of the candle based on the range between the current percent and min/max value
-The brightest candle provides the highest compound effect to you account if you act on it at the open.
-Candles that have a percentage close to the average then they are barely visible = lowest compound effect to your account
This indicator functions like a "heatmap" for candles, highlighting the relative volatility of price movements in both directions. Strong bullish candles are brighter green, and strong bearish candles are brighter red. It's particularly useful for traders wanting quick visual feedback on price volatility and strength trends within the last 100 bars.
Phát hành các Ghi chú
we have made the candles yellow if they reach maximum or minimum values in percentage change. meaning those are the candles which you will achieve the highest compound effect Mã nguồn mở
Theo đúng tinh thần TradingView, tác giả của tập lệnh này đã công bố nó dưới dạng mã nguồn mở, để các nhà giao dịch có thể xem xét và xác minh chức năng. Chúc mừng tác giả! Mặc dù bạn có thể sử dụng miễn phí, hãy nhớ rằng việc công bố lại mã phải tuân theo Nội quy.
Thông báo miễn trừ trách nhiệm
Thông tin và các ấn phẩm này không nhằm mục đích, và không cấu thành, lời khuyên hoặc khuyến nghị về tài chính, đầu tư, giao dịch hay các loại khác do TradingView cung cấp hoặc xác nhận. Đọc thêm tại Điều khoản Sử dụng.
Mã nguồn mở
Theo đúng tinh thần TradingView, tác giả của tập lệnh này đã công bố nó dưới dạng mã nguồn mở, để các nhà giao dịch có thể xem xét và xác minh chức năng. Chúc mừng tác giả! Mặc dù bạn có thể sử dụng miễn phí, hãy nhớ rằng việc công bố lại mã phải tuân theo Nội quy.
Thông báo miễn trừ trách nhiệm
Thông tin và các ấn phẩm này không nhằm mục đích, và không cấu thành, lời khuyên hoặc khuyến nghị về tài chính, đầu tư, giao dịch hay các loại khác do TradingView cung cấp hoặc xác nhận. Đọc thêm tại Điều khoản Sử dụng.