OPEN-SOURCE SCRIPT
Dynamic Support and Resistance -AYNET
Explanation of the Code
Lookback Period:
The lookback input defines how many candles to consider when calculating the support (lowest low) and resistance (highest high).
Support and Resistance Calculation:
ta.highest(high, lookback) identifies the highest high over the last lookback candles.
ta.lowest(low, lookback) identifies the lowest low over the same period.
Dynamic Lines:
The line.new function creates yellow horizontal lines at the calculated support and resistance levels, extending them to the right.
Optional Plot:
plot is used to display the support and resistance levels as lines for visual clarity.
Customization:
You can adjust the lookback period and toggle the visibility of the lines via inputs.
How to Use This Code
Open the Pine Script Editor in TradingView.
Paste the above code into the editor.
Adjust the "Lookback Period for High/Low" to customize how the levels are calculated.
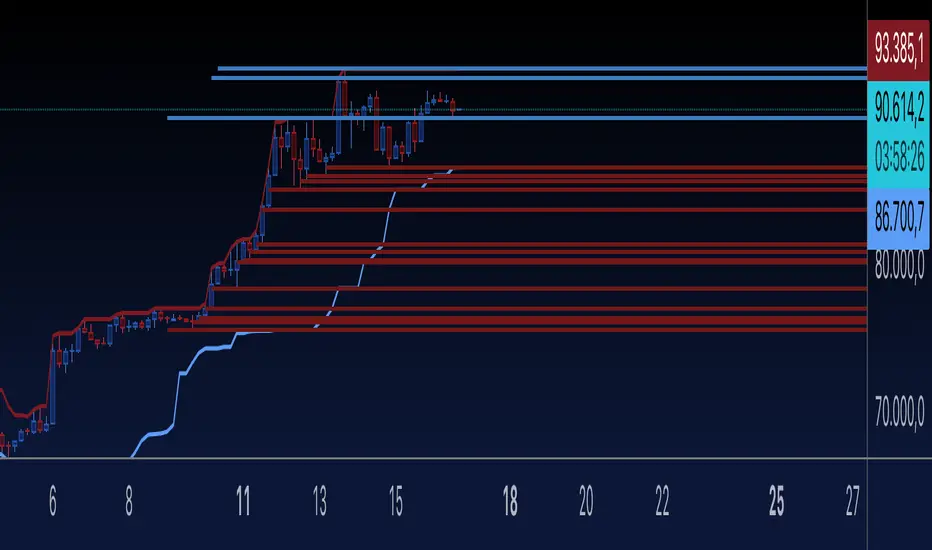
Enable or disable the support and resistance lines as needed.
This will create a chart similar to the one you provided, with horizontal yellow lines dynamically indicating the support and resistance levels. Let me know if you'd like any additional features or customizations!
Lookback Period:
The lookback input defines how many candles to consider when calculating the support (lowest low) and resistance (highest high).
Support and Resistance Calculation:
ta.highest(high, lookback) identifies the highest high over the last lookback candles.
ta.lowest(low, lookback) identifies the lowest low over the same period.
Dynamic Lines:
The line.new function creates yellow horizontal lines at the calculated support and resistance levels, extending them to the right.
Optional Plot:
plot is used to display the support and resistance levels as lines for visual clarity.
Customization:
You can adjust the lookback period and toggle the visibility of the lines via inputs.
How to Use This Code
Open the Pine Script Editor in TradingView.
Paste the above code into the editor.
Adjust the "Lookback Period for High/Low" to customize how the levels are calculated.
Enable or disable the support and resistance lines as needed.
This will create a chart similar to the one you provided, with horizontal yellow lines dynamically indicating the support and resistance levels. Let me know if you'd like any additional features or customizations!
Mã nguồn mở
Theo đúng tinh thần TradingView, tác giả của tập lệnh này đã công bố nó dưới dạng mã nguồn mở, để các nhà giao dịch có thể xem xét và xác minh chức năng. Chúc mừng tác giả! Mặc dù bạn có thể sử dụng miễn phí, hãy nhớ rằng việc công bố lại mã phải tuân theo Nội quy.
Thông báo miễn trừ trách nhiệm
Thông tin và các ấn phẩm này không nhằm mục đích, và không cấu thành, lời khuyên hoặc khuyến nghị về tài chính, đầu tư, giao dịch hay các loại khác do TradingView cung cấp hoặc xác nhận. Đọc thêm tại Điều khoản Sử dụng.