OPEN-SOURCE SCRIPT
Cập nhật MACD+RSI+Flag v2 by RM
This source code is subject to the terms of the Mozilla Public License 2.0 at mozilla.org/MPL/2.0/
There are a number of very clever people I have taken bits of code and ideas, thanks to you all :) © raul3429
investopedia.com/
RSI: The relative strength index (RSI) is a momentum indicator measures recent price changes to evaluate overbought or oversold conditions.
MACD: Moving average convergence divergence (MACD) is a trend-following momentum indicator that shows the relationship between two moving averages of a security’s price. The MACD is = 12EMA - 26EMA, The histogram represent this difference.
Notes:
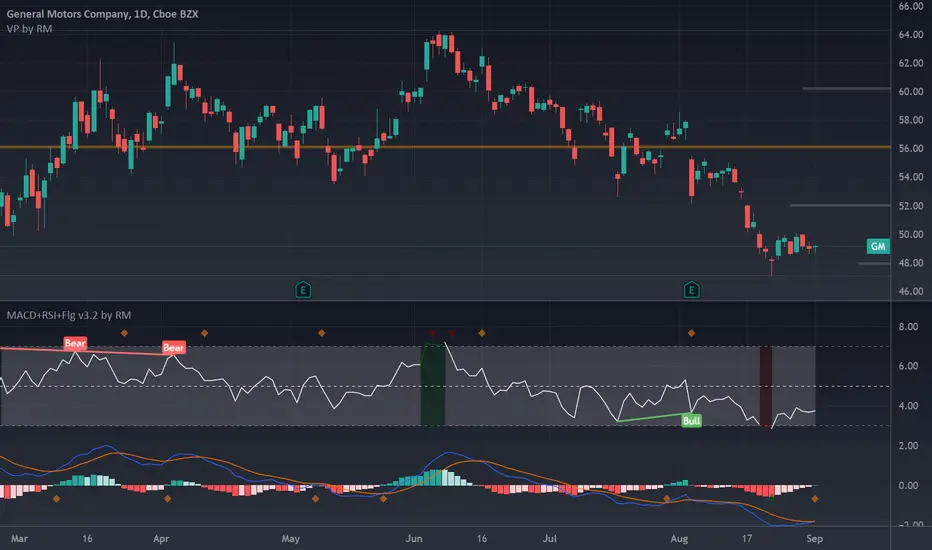
This code has Flags for first candle change during oversold/overbought shown as triangles, also and MACD 12 and MACD 26 crossings as diamonds. These are sometimes indicators of trend change.
RSI has been scaled down by "scaleRSI" parameter to enable plotting alongside MACD
Depending on the security being evaluated the RSI scale may need to be adjusted as the MACD ranges vary between symbols.
Disclaimer:
This is not a Financial advisory tool. For education purposes only. Use at your own risk.
There are a number of very clever people I have taken bits of code and ideas, thanks to you all :) © raul3429
investopedia.com/
RSI: The relative strength index (RSI) is a momentum indicator measures recent price changes to evaluate overbought or oversold conditions.
MACD: Moving average convergence divergence (MACD) is a trend-following momentum indicator that shows the relationship between two moving averages of a security’s price. The MACD is = 12EMA - 26EMA, The histogram represent this difference.
Notes:
This code has Flags for first candle change during oversold/overbought shown as triangles, also and MACD 12 and MACD 26 crossings as diamonds. These are sometimes indicators of trend change.
RSI has been scaled down by "scaleRSI" parameter to enable plotting alongside MACD
Depending on the security being evaluated the RSI scale may need to be adjusted as the MACD ranges vary between symbols.
Disclaimer:
This is not a Financial advisory tool. For education purposes only. Use at your own risk.
Phát hành các Ghi chú
This update (v3) has improved visibility of overbought/oversold conditions in the RSI chart component. This code has Flags for first candle change during oversold/overbought shown as triangles, also and MACD 12 and MACD 26 crossings as diamonds.
RSI has been scaled down by "scaleRSI" parameter to enable plotting alongside MACD. User may need to adjust Scale as required to shown RSI & MACD.
RSI: The relative strength index (RSI) is a momentum indicator measures recent price changes to evaluate overbought or oversold conditions.
MACD: Moving average convergence divergence (MACD) is a trend-following momentum indicator that shows the relationship between two moving averages of a security’s price. The MACD is = 12EMA - 26EMA, The histogram represent this difference.
Disclaimer: This is not a Financial advisory tool. For education purposes only. Use at your own risk.
Phát hành các Ghi chú
V3.2 Added Divergence indicator plus other minor changes (color definition, inclusion of color to indicator line and band, fixed scaling and improved explanations)Mã nguồn mở
Theo đúng tinh thần TradingView, tác giả của tập lệnh này đã công bố nó dưới dạng mã nguồn mở, để các nhà giao dịch có thể xem xét và xác minh chức năng. Chúc mừng tác giả! Mặc dù bạn có thể sử dụng miễn phí, hãy nhớ rằng việc công bố lại mã phải tuân theo Nội quy.
Thông báo miễn trừ trách nhiệm
Thông tin và các ấn phẩm này không nhằm mục đích, và không cấu thành, lời khuyên hoặc khuyến nghị về tài chính, đầu tư, giao dịch hay các loại khác do TradingView cung cấp hoặc xác nhận. Đọc thêm tại Điều khoản Sử dụng.
Mã nguồn mở
Theo đúng tinh thần TradingView, tác giả của tập lệnh này đã công bố nó dưới dạng mã nguồn mở, để các nhà giao dịch có thể xem xét và xác minh chức năng. Chúc mừng tác giả! Mặc dù bạn có thể sử dụng miễn phí, hãy nhớ rằng việc công bố lại mã phải tuân theo Nội quy.
Thông báo miễn trừ trách nhiệm
Thông tin và các ấn phẩm này không nhằm mục đích, và không cấu thành, lời khuyên hoặc khuyến nghị về tài chính, đầu tư, giao dịch hay các loại khác do TradingView cung cấp hoặc xác nhận. Đọc thêm tại Điều khoản Sử dụng.