OPEN-SOURCE SCRIPT
Cập nhật FalconRed 3 Candlestick Levels
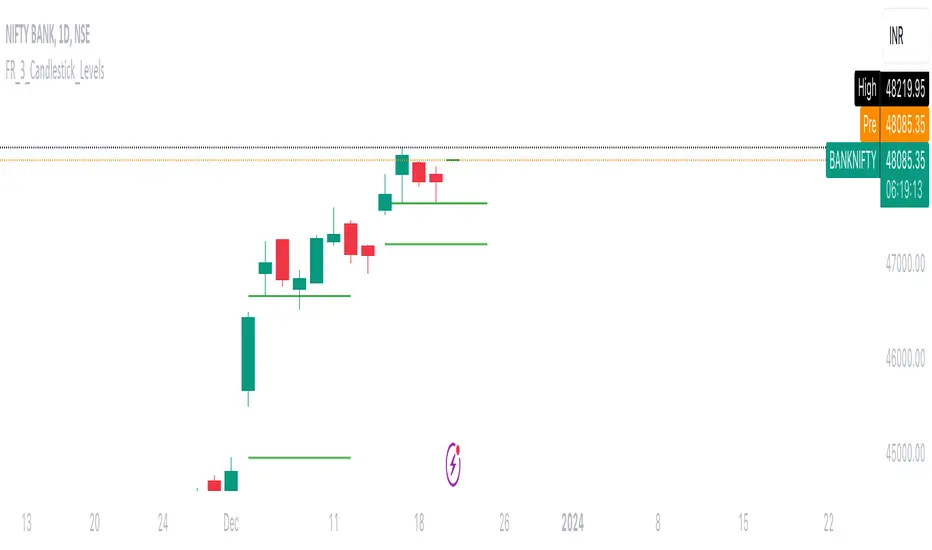
This Pine Script indicator is designed to enhance price action analysis by identifying specific candle patterns that signal potential buying and selling levels. The analysis is based on the characteristics of the current candle and its two immediate predecessors.
For identifying buying levels, the script examines the wicks of the candles, highlighting areas where buying and selling struggle is evident. The indicator recognizes significant breaks above wick levels, especially when followed by a subsequent candle with a lower wick. This combination suggests that previous selling pressure has been challenged and overcome.
Buy breakout and retest levels are highlighted with green color, providing a clear visual indication of potential buying opportunities. The indicator draws horizontal lines that extend to the right, offering insights into the frequency of retests and the recurrence of similar patterns in specific price zones, thereby confirming and reinforcing the observed price action.
Similarly, the indicator scrutinizes the selling side, pinpointing breakdown and retest levels. These areas are highlighted with red color, aiding in the identification of potential selling opportunities.
This indicator serves as a valuable tool for analyzing price action levels and visualizing buying and selling areas. It can be effectively combined with other technical indicators to enhance confidence in trading decisions. Gain deeper insights into market dynamics and improve decision-making by integrating this candle pattern analysis indicator into your trading strategy.
Phát hành các Ghi chú
This Pine Script indicator is designed to enhance price action analysis by identifying specific candle patterns that signal potential buying and selling levels. The analysis is based on the characteristics of the current candle and its two immediate predecessors.For identifying buying levels, the script examines the wicks of the candles, highlighting areas where buying and selling struggle is evident. The indicator recognizes significant breaks above wick levels, especially when followed by a subsequent candle with a lower wick. This combination suggests that previous selling pressure has been challenged and overcome.
Buy breakout and retest levels are highlighted with green color, providing a clear visual indication of potential buying opportunities. The indicator draws horizontal lines that extend to the right, offering insights into the frequency of retests and the recurrence of similar patterns in specific price zones, thereby confirming and reinforcing the observed price action.
Similarly, the indicator scrutinizes the selling side, pinpointing breakdown and retest levels. These areas are highlighted with red color, aiding in the identification of potential selling opportunities.
This indicator serves as a valuable tool for analyzing price action levels and visualizing buying and selling areas. It can be effectively combined with other technical indicators to enhance confidence in trading decisions. Gain deeper insights into market dynamics and improve decision-making by integrating this candle pattern analysis indicator into your trading strategy.
Mã nguồn mở
Theo đúng tinh thần TradingView, tác giả của tập lệnh này đã công bố nó dưới dạng mã nguồn mở, để các nhà giao dịch có thể xem xét và xác minh chức năng. Chúc mừng tác giả! Mặc dù bạn có thể sử dụng miễn phí, hãy nhớ rằng việc công bố lại mã phải tuân theo Nội quy.
Thông báo miễn trừ trách nhiệm
Thông tin và các ấn phẩm này không nhằm mục đích, và không cấu thành, lời khuyên hoặc khuyến nghị về tài chính, đầu tư, giao dịch hay các loại khác do TradingView cung cấp hoặc xác nhận. Đọc thêm tại Điều khoản Sử dụng.