OPEN-SOURCE SCRIPT
Cập nhật Vortex Indicator With SMA
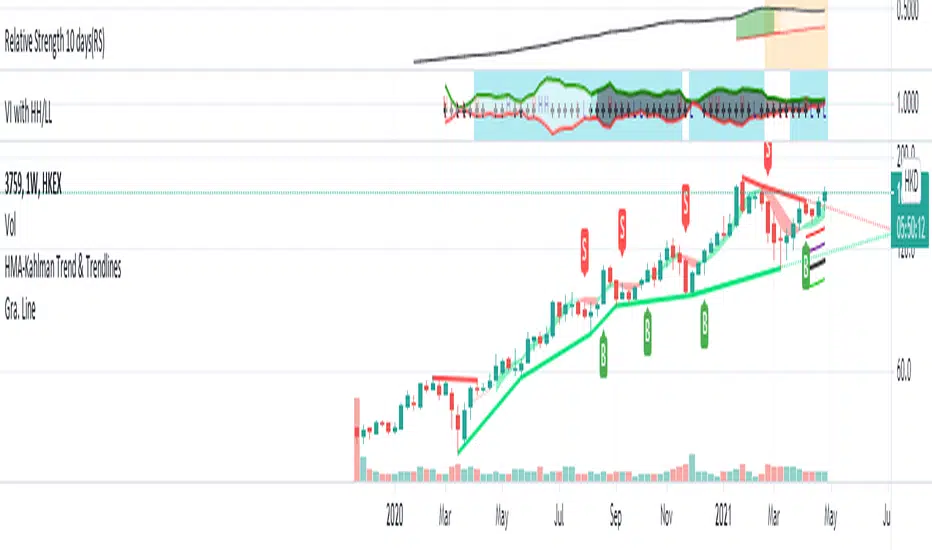
VI with SMA to determine the trend is solid.
VI+ cross over VI- with price over 20 SMA to confirm the trend.
Also, you can see the enhanced trend:
VI+ with the Letter H, with new high in the observe period.
VI- with the Letter L, with new high in the observe period.
Coding based on the original Vortex Indicator.
VI+ cross over VI- with price over 20 SMA to confirm the trend.
Also, you can see the enhanced trend:
VI+ with the Letter H, with new high in the observe period.
VI- with the Letter L, with new high in the observe period.
Coding based on the original Vortex Indicator.
Phát hành các Ghi chú
Add Test VI+, VI- with uptrend STR (Sum of ATR)Phát hành các Ghi chú
Check stocks SMA uptrend sequence with VIPhát hành các Ghi chú
Uptrend SMA Seq. title.Phát hành các Ghi chú
1: Modified the Background highlight factor:either use SMA or Donchain Channel mid line as Oscillator.
2: Fill the area between VI+ and VI - when the SMA uptrend Sequence is valid.
Phát hành các Ghi chú
Traditionally, vortex indicator (VI) is an indicator composed of two lines : an uptrend line (VI+) : measure the price of the stock going up
a downtrend line (VI-) : measure the price of the stock going down
bleached areas within two VI lines is showing the "the fastEMA above slowEMA" of the stock.
eg. SMA10 > SMA40
"H" means that the VI+ > 5 days average VI+, which means stock price is move up relative to the price past 5 days average. ( simply is price action hgiher high)
"L" means that the VI- > 5 days average VI-, which means stock price decline relative to the price past 5 days average. ( simply is price action lower low)
In conclusion, I create this indicator help to easily knowing a stock is in uptrend and the momentum is maintain.
Two examples:
Look for Uptrend stock
1) the trading logic is looking for uptrend stocks (with blue background).
2) blue background where [VI+ is above VI- ] and [ stock price is above EMA or Donchain channel] .
3) "H" equal to [ VI+ is increase ] means the up-force is improving. "H" in red mean the price velocity is increase.
4) it is better hold the stock when the VI+ is keep move up. and be alert the "L" show up.
Look for Bottom UP/Breakout
1) when the background is in PINK, means [ VI- > VI+ ]. Stock is in downtrend.
2) waiting for the word "H" show up in frequent (several times), mean the stock price start have a high compare 5 days average.
3) wait for the crossover of the VI+ and VI- and the background to Blue.
Mã nguồn mở
Theo đúng tinh thần TradingView, tác giả của tập lệnh này đã công bố nó dưới dạng mã nguồn mở, để các nhà giao dịch có thể xem xét và xác minh chức năng. Chúc mừng tác giả! Mặc dù bạn có thể sử dụng miễn phí, hãy nhớ rằng việc công bố lại mã phải tuân theo Nội quy.
Thông báo miễn trừ trách nhiệm
Thông tin và các ấn phẩm này không nhằm mục đích, và không cấu thành, lời khuyên hoặc khuyến nghị về tài chính, đầu tư, giao dịch hay các loại khác do TradingView cung cấp hoặc xác nhận. Đọc thêm tại Điều khoản Sử dụng.