OPEN-SOURCE SCRIPT
Cập nhật Stochastic Trend mtf
Definition
The Stochastic RSI indicator (Stoch RSI) is actually an indicator of an indicator. It is used in technical analysis to provide a stochastic calculation to the RSI indicator. This means it's an RSI measure relative to its own high/low range over a user-defined time period. Stochastic RSI is an oscillator that calculates a value between 0 and 1 and then plots it as a line. This indicator is primarily used to identify overbought and oversold conditions.
It is important to remember that the Stoch RSI is an indicator of an indicator that is two steps away from the price. The RSI is one step away from the price and therefore a stochastic calculation of the RSI is two steps away. This is important because as with any indicator that is more than one step away from price, the Stoch RSI can be short-term disconnected from actual price action. However, as a range-bound indicator, the Stoch RSI's primary function is to identify cross-bought, overbought and oversold conditions.
Use
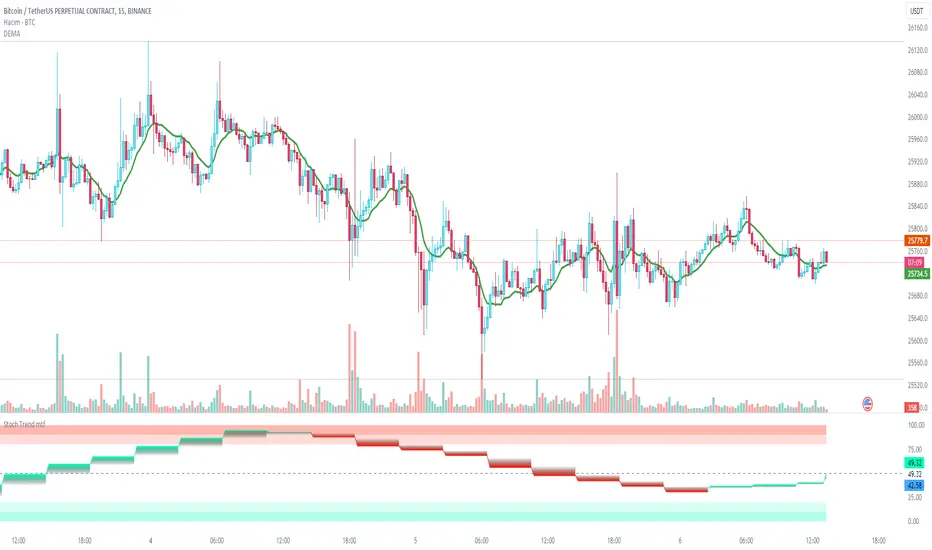
When we integrate it into our chart in the upper time frame, it both gives the direction of the trend more healthy and is more efficient in terms of noise reduction in terms of leaving the overbought-sold zones. Unlike the classic stochastic, I set the "d" value to 8. Even though the trend returns are a little late, we see healthier data on our graph. Trend changes in overbought zones are getting stronger. Coloring red indicates that the trend is selling, while painting green indicates that the trend is buying. I hope you find it useful, if you have any questions or suggestions, please feel free to ask.
Good luck...
It is not investment advice.
The Stochastic RSI indicator (Stoch RSI) is actually an indicator of an indicator. It is used in technical analysis to provide a stochastic calculation to the RSI indicator. This means it's an RSI measure relative to its own high/low range over a user-defined time period. Stochastic RSI is an oscillator that calculates a value between 0 and 1 and then plots it as a line. This indicator is primarily used to identify overbought and oversold conditions.
It is important to remember that the Stoch RSI is an indicator of an indicator that is two steps away from the price. The RSI is one step away from the price and therefore a stochastic calculation of the RSI is two steps away. This is important because as with any indicator that is more than one step away from price, the Stoch RSI can be short-term disconnected from actual price action. However, as a range-bound indicator, the Stoch RSI's primary function is to identify cross-bought, overbought and oversold conditions.
Use
When we integrate it into our chart in the upper time frame, it both gives the direction of the trend more healthy and is more efficient in terms of noise reduction in terms of leaving the overbought-sold zones. Unlike the classic stochastic, I set the "d" value to 8. Even though the trend returns are a little late, we see healthier data on our graph. Trend changes in overbought zones are getting stronger. Coloring red indicates that the trend is selling, while painting green indicates that the trend is buying. I hope you find it useful, if you have any questions or suggestions, please feel free to ask.
Good luck...
It is not investment advice.
Phát hành các Ghi chú
DefinitionThe Stochastic RSI indicator (Stoch RSI) is actually an indicator of an indicator. It is used in technical analysis to provide a stochastic calculation to the RSI indicator. This means it's an RSI measure relative to its own high/low range over a user-defined time period. Stochastic RSI is an oscillator that calculates a value between 0 and 1 and then plots it as a line. This indicator is primarily used to identify overbought and oversold conditions.
It is important to remember that the Stoch RSI is an indicator of an indicator that is two steps away from the price. The RSI is one step away from the price and therefore a stochastic calculation of the RSI is two steps away. This is important because as with any indicator that is more than one step away from price, the Stoch RSI can be short-term disconnected from actual price action. However, as a range-bound indicator, the Stoch RSI's primary function is to identify cross-bought, overbought and oversold conditions.
Use
When we integrate it into our chart in the upper time frame, it both gives the direction of the trend more healthy and is more efficient in terms of noise reduction in terms of leaving the overbought-sold zones. Unlike the classic stochastic, I set the "d" value to 8. Even though the trend returns are a little late, we see healthier data on our graph. Trend changes in overbought zones are getting stronger. Coloring red indicates that the trend is selling, while painting green indicates that the trend is buying. I hope you find it useful, if you have any questions or suggestions, please feel free to ask.
Good luck...
It is not investment advice.
Bar color feature added. 12/08/2024
Mã nguồn mở
Theo đúng tinh thần TradingView, tác giả của tập lệnh này đã công bố nó dưới dạng mã nguồn mở, để các nhà giao dịch có thể xem xét và xác minh chức năng. Chúc mừng tác giả! Mặc dù bạn có thể sử dụng miễn phí, hãy nhớ rằng việc công bố lại mã phải tuân theo Nội quy.
Thông báo miễn trừ trách nhiệm
Thông tin và các ấn phẩm này không nhằm mục đích, và không cấu thành, lời khuyên hoặc khuyến nghị về tài chính, đầu tư, giao dịch hay các loại khác do TradingView cung cấp hoặc xác nhận. Đọc thêm tại Điều khoản Sử dụng.