OPEN-SOURCE SCRIPT
Cập nhật Fukuiz Trend
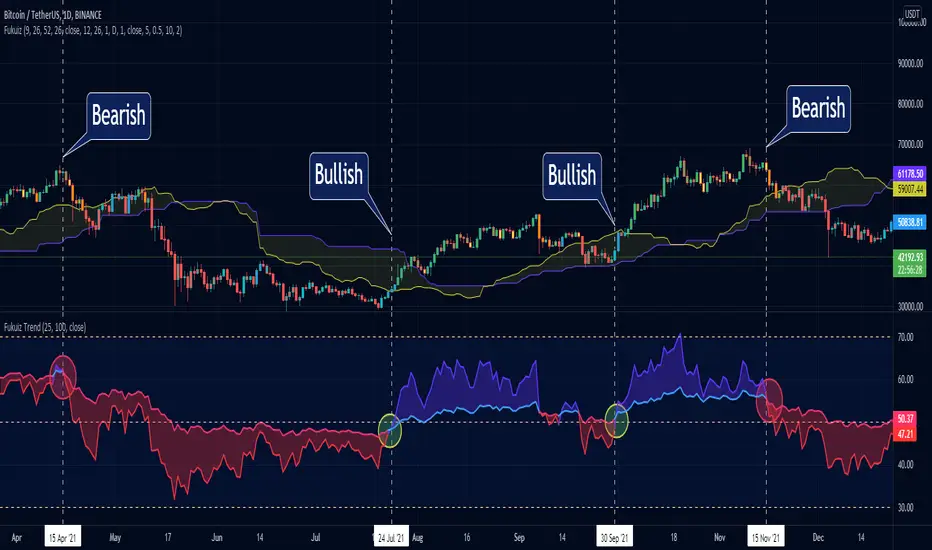
This indicator base on RSI of 2 different periond.
#A brief introduction to RSI #
The relative strength index (RSI) is a momentum indicator used in technical analysis that measures the magnitude of recent price changes to evaluate overbought or oversold conditions in the price of a stock or other asset. The RSI is displayed as an oscillator (a line graph that moves between two extremes) and can have a reading from 0 to 100. The indicator was originally developed by J. Welles Wilder Jr. and introduced in his seminal 1978 book, “New Concepts in Technical Trading Systems.”
Traditional interpretation and usage of the RSI are that values of 70 or above indicate that a security is becoming overbought or overvalued and may be primed for a trend reversal or corrective pullback in price. An RSI reading of 30 or below indicates an oversold or undervalued condition.
#In this indicator#
I see that you can use 2 RSI with different periond to suggest Bullish trend and Bearish trend.
#Conditions between short and long RSI crossing#
Crossover = Bullish trend (blue zone)
Crossunder = Bearish trend (red zone)
Phát hành các Ghi chú
Minor fixPhát hành các Ghi chú
Update-Add Bullish/Bearish Divergence Signal.
Phát hành các Ghi chú
:Update-Convert Pine Script to V.5
-Edit Default Setting
Mã nguồn mở
Theo đúng tinh thần TradingView, tác giả của tập lệnh này đã công bố nó dưới dạng mã nguồn mở, để các nhà giao dịch có thể xem xét và xác minh chức năng. Chúc mừng tác giả! Mặc dù bạn có thể sử dụng miễn phí, hãy nhớ rằng việc công bố lại mã phải tuân theo Nội Quy.
Thông báo miễn trừ trách nhiệm
Thông tin và các ấn phẩm này không nhằm mục đích, và không cấu thành, lời khuyên hoặc khuyến nghị về tài chính, đầu tư, giao dịch hay các loại khác do TradingView cung cấp hoặc xác nhận. Đọc thêm tại Điều khoản Sử dụng.