OPEN-SOURCE SCRIPT
MFI Nexus Pro [trade_lexx]
📈 MFI Nexus Pro [trade_lexx] is your reliable trading assistant!

📊 What is MFI Nexus Pro ?
MFI Nexus Pro is a trading indicator that analyzes cash flows in the market. It shows where money is moving — into or out of an asset, and based on this, generates buy or sell signals.
💡 The main components of the indicator
📊 The MFI Cash Flow Index (MFI)
shows the strength of cash flow into an asset. Values above 70 indicate overbought (an early sale is possible), and values below 30 indicate oversold (an early purchase is possible).
📈 Moving Averages (MA)
The indicator uses 10 different types of moving averages to smooth the MFI line.:
- SMA: Simple moving average
- EMA: Exponential moving average
- WMA: Weighted moving average
And other more complex types (HMA, KAMA, VWMA, ALMA, TEMA, ZLEMA, DEMA)

The choice of the type of moving average affects the speed of the indicator's response to market changes.
🎯 Bollinger Bands (BB)
Bands around the moving average that widen and narrow depending on volatility. They help determine when the MFI is out of the normal range.
🔄 Divergences
Divergences show discrepancies between price and MFI:
- Bullish divergence: the price is falling and the MFI is rising — an upward reversal is possible
- Bearish divergence: the price is rising and the MFI is falling — a downward reversal is possible
🔍 Indicator signals

1️⃣ Moving average signals (MA)
Buy signal
- What happens: MFI crosses its moving average from bottom to top
- What does it look like: the green triangle labeled "MA" under the chart
- What does it mean: money begins to actively flow into the asset, price growth is possible
Sell signal
- What happens: the MFI crosses the moving average from top to bottom
- What does it look like: a red triangle with the label "MA" above the chart
- What does it mean: money starts to leave the asset, the price may fall
2️⃣ Bollinger Band Signals (BB)
Buy signal
- What's happening: The MFI crosses the lower Bollinger band from bottom to top
- What it looks like: the green triangle marked "BB"
- What it means: The MFI was too low and is now starting to recover
Sell Signal
- What's going on: MFI crosses the upper Bollinger band from top to bottom
- What it looks like: a red triangle marked "BB"
- What it means: The MFI was too high and is now starting to decline
3️⃣ Divergence Signals (Div)
Buy Signal (Bullish Divergence)
- What's going on: the price is falling more than the MFI
- What it looks like: a green triangle marked "Div"
- What it means: despite the fall in price, money is already starting to return to the asset
Sell signal (bearish divergence)
- What is happening: the price is rising more strongly than the MFI
- What does it look like: the red triangle with the label "Div"
- What does it mean: despite the price increase, money is already starting to leave the asset
🛠️ Filters to filter out false signals
1️⃣ Minimum distance between the signals

- What it does: sets the minimum number of candles between signals
- Why it is needed: prevents signals from being too frequent during strong market fluctuations
- How to set it up: Set the number from 0 and above (default: 5)
2️⃣ "Waiting for the opposite signal" mode

- What it does: waits for a signal in the opposite direction before generating a new signal
- Why you need it: it helps you not to miss important trend reversals
- How to set up: just turn the function on or off
3️⃣ Filter by MFI levels
- What it does: generates signals only when the MFI is in the specified ranges
- Why it is needed: it helps to catch the moments when the market is oversold or overbought
- How to set up:
- For buy signals: set a range for oversold (e.g. 1-30)
- For sell signals: set a range for overbought (e.g. 70-100)

4️⃣ The RSI filter
- What it does: additionally checks the RSI values to confirm the signals
- Why it is needed: adds additional confirmation from another popular indicator
- How to set up: Similar to the MFI filter, set ranges for buying and selling
🔄 Signal combination modes

1️⃣ Normal mode ("None")
- How it works: all signals (MA, BB, Div) work independently of each other
- When to use it: for general market analysis or when learning how to work with the indicator
2️⃣ "And" mode ("MA and BB and Div")
- How it works: the alarm appears only when several conditions are triggered simultaneously
- Combination options:
- MA+BB: signals from the moving average and Bollinger bands
- MA+Div: signals from the moving average and divergence
- BB+Div: signals from the Bollinger bands and divergence
- MA+BB+Div: all three signals simultaneously
- When to use: for more reliable but rare signals
3️⃣ "OR" mode ("MA or BB or Div")
- How it works: the alarm appears when any of the conditions are triggered
- When to use: for frequent signals when you don't want to miss any opportunity.
🔌 Connecting to trading strategies
The indicator can be connected to your trading strategies using 5 different channels.:
1. Channel for MA signals: connects only signals from moving averages
2. BB signal channel: connects only the signals from the Bollinger bands
3. Channel for divergence signals: connects only divergence signals
4. Channel for "And" mode: connects only combined signals
5. Channel for "OR" mode: connects signals from any source

🔔 Setting up alerts
The indicator can send alerts when alarms appear.:
- Alerts for MA: when the MFI crosses the moving average
- Alerts for BB: when the MFI crosses the Bollinger bands
- Divergence alerts: when a divergence is detected
- Combined alerts: for "AND" and "OR" modes
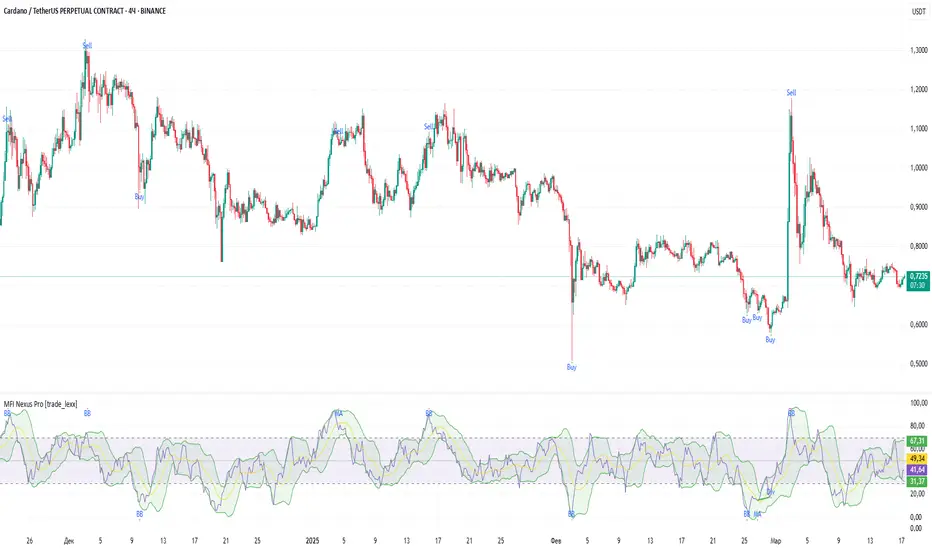
🎭 What does the indicator look like on the chart ?
- MFI main line: purple line
- Overbought/oversold levels: horizontal lines at levels 30 and 70
- Middle line: dotted line at level 50
- MFI Moving Average: yellow line
- Bollinger bands: green lines around the moving average
- Signals: green and red triangles with corresponding labels
📚 How to start using MFI Nexus Pro
1️⃣ Initial setup
- Add an indicator to your chart
- Select the type of moving average and the period (you can leave it as the default)
- Activate the desired signal types (MA, BB, Div)
2️⃣ Filter settings
- Set the distance between the signals to get rid of unnecessary noise
- Adjust the MFI and RSI levels depending on how volatile your asset is
- If you need more reliable signals, turn on the "Waiting for the opposite signal" mode.
3️⃣ Operation mode selection
- First, use the standard mode to see all possible signals.
- When you get comfortable, try the "And" mode for more reliable signals.
- For active trading, you can use the "OR" mode
4️⃣ Setting up Alerts
- Select the types of signals you want to be notified about
- Set up alerts for "AND" or "OR" modes if you use them
5️⃣ Verification and adaptation
- Check the operation of the indicator on historical data
- Adjust the parameters for a specific asset
- Adapt the settings to your trading style
🌟 Usage examples
For trend trading
- Use MA signals in the direction of the main trend
- Turn on the "Waiting for the opposite signal" mode
- Set stricter levels for filters
For trading in a sideways range
- Use BB signals to detect bounces from the range boundaries
- Use the MFI level filter to confirm overbought/oversold conditions
- Adjust the Bollinger bands according to the width of the range
To determine the pivot points
- Pay attention to the divergence signals
- Use the "And" mode by combining divergences with other signals
- Check the RSI filter for additional confirmation
📊 What is MFI Nexus Pro ?
MFI Nexus Pro is a trading indicator that analyzes cash flows in the market. It shows where money is moving — into or out of an asset, and based on this, generates buy or sell signals.
💡 The main components of the indicator
📊 The MFI Cash Flow Index (MFI)
shows the strength of cash flow into an asset. Values above 70 indicate overbought (an early sale is possible), and values below 30 indicate oversold (an early purchase is possible).
📈 Moving Averages (MA)
The indicator uses 10 different types of moving averages to smooth the MFI line.:
- SMA: Simple moving average
- EMA: Exponential moving average
- WMA: Weighted moving average
And other more complex types (HMA, KAMA, VWMA, ALMA, TEMA, ZLEMA, DEMA)
The choice of the type of moving average affects the speed of the indicator's response to market changes.
🎯 Bollinger Bands (BB)
Bands around the moving average that widen and narrow depending on volatility. They help determine when the MFI is out of the normal range.
🔄 Divergences
Divergences show discrepancies between price and MFI:
- Bullish divergence: the price is falling and the MFI is rising — an upward reversal is possible
- Bearish divergence: the price is rising and the MFI is falling — a downward reversal is possible
🔍 Indicator signals
1️⃣ Moving average signals (MA)
Buy signal
- What happens: MFI crosses its moving average from bottom to top
- What does it look like: the green triangle labeled "MA" under the chart
- What does it mean: money begins to actively flow into the asset, price growth is possible
Sell signal
- What happens: the MFI crosses the moving average from top to bottom
- What does it look like: a red triangle with the label "MA" above the chart
- What does it mean: money starts to leave the asset, the price may fall
2️⃣ Bollinger Band Signals (BB)
Buy signal
- What's happening: The MFI crosses the lower Bollinger band from bottom to top
- What it looks like: the green triangle marked "BB"
- What it means: The MFI was too low and is now starting to recover
Sell Signal
- What's going on: MFI crosses the upper Bollinger band from top to bottom
- What it looks like: a red triangle marked "BB"
- What it means: The MFI was too high and is now starting to decline
3️⃣ Divergence Signals (Div)
Buy Signal (Bullish Divergence)
- What's going on: the price is falling more than the MFI
- What it looks like: a green triangle marked "Div"
- What it means: despite the fall in price, money is already starting to return to the asset
Sell signal (bearish divergence)
- What is happening: the price is rising more strongly than the MFI
- What does it look like: the red triangle with the label "Div"
- What does it mean: despite the price increase, money is already starting to leave the asset
🛠️ Filters to filter out false signals
1️⃣ Minimum distance between the signals
- What it does: sets the minimum number of candles between signals
- Why it is needed: prevents signals from being too frequent during strong market fluctuations
- How to set it up: Set the number from 0 and above (default: 5)
2️⃣ "Waiting for the opposite signal" mode
- What it does: waits for a signal in the opposite direction before generating a new signal
- Why you need it: it helps you not to miss important trend reversals
- How to set up: just turn the function on or off
3️⃣ Filter by MFI levels
- What it does: generates signals only when the MFI is in the specified ranges
- Why it is needed: it helps to catch the moments when the market is oversold or overbought
- How to set up:
- For buy signals: set a range for oversold (e.g. 1-30)
- For sell signals: set a range for overbought (e.g. 70-100)
4️⃣ The RSI filter
- What it does: additionally checks the RSI values to confirm the signals
- Why it is needed: adds additional confirmation from another popular indicator
- How to set up: Similar to the MFI filter, set ranges for buying and selling
🔄 Signal combination modes
1️⃣ Normal mode ("None")
- How it works: all signals (MA, BB, Div) work independently of each other
- When to use it: for general market analysis or when learning how to work with the indicator
2️⃣ "And" mode ("MA and BB and Div")
- How it works: the alarm appears only when several conditions are triggered simultaneously
- Combination options:
- MA+BB: signals from the moving average and Bollinger bands
- MA+Div: signals from the moving average and divergence
- BB+Div: signals from the Bollinger bands and divergence
- MA+BB+Div: all three signals simultaneously
- When to use: for more reliable but rare signals
3️⃣ "OR" mode ("MA or BB or Div")
- How it works: the alarm appears when any of the conditions are triggered
- When to use: for frequent signals when you don't want to miss any opportunity.
🔌 Connecting to trading strategies
The indicator can be connected to your trading strategies using 5 different channels.:
1. Channel for MA signals: connects only signals from moving averages
2. BB signal channel: connects only the signals from the Bollinger bands
3. Channel for divergence signals: connects only divergence signals
4. Channel for "And" mode: connects only combined signals
5. Channel for "OR" mode: connects signals from any source
🔔 Setting up alerts
The indicator can send alerts when alarms appear.:
- Alerts for MA: when the MFI crosses the moving average
- Alerts for BB: when the MFI crosses the Bollinger bands
- Divergence alerts: when a divergence is detected
- Combined alerts: for "AND" and "OR" modes
🎭 What does the indicator look like on the chart ?
- MFI main line: purple line
- Overbought/oversold levels: horizontal lines at levels 30 and 70
- Middle line: dotted line at level 50
- MFI Moving Average: yellow line
- Bollinger bands: green lines around the moving average
- Signals: green and red triangles with corresponding labels
📚 How to start using MFI Nexus Pro
1️⃣ Initial setup
- Add an indicator to your chart
- Select the type of moving average and the period (you can leave it as the default)
- Activate the desired signal types (MA, BB, Div)
2️⃣ Filter settings
- Set the distance between the signals to get rid of unnecessary noise
- Adjust the MFI and RSI levels depending on how volatile your asset is
- If you need more reliable signals, turn on the "Waiting for the opposite signal" mode.
3️⃣ Operation mode selection
- First, use the standard mode to see all possible signals.
- When you get comfortable, try the "And" mode for more reliable signals.
- For active trading, you can use the "OR" mode
4️⃣ Setting up Alerts
- Select the types of signals you want to be notified about
- Set up alerts for "AND" or "OR" modes if you use them
5️⃣ Verification and adaptation
- Check the operation of the indicator on historical data
- Adjust the parameters for a specific asset
- Adapt the settings to your trading style
🌟 Usage examples
For trend trading
- Use MA signals in the direction of the main trend
- Turn on the "Waiting for the opposite signal" mode
- Set stricter levels for filters
For trading in a sideways range
- Use BB signals to detect bounces from the range boundaries
- Use the MFI level filter to confirm overbought/oversold conditions
- Adjust the Bollinger bands according to the width of the range
To determine the pivot points
- Pay attention to the divergence signals
- Use the "And" mode by combining divergences with other signals
- Check the RSI filter for additional confirmation
Mã nguồn mở
Theo đúng tinh thần TradingView, tác giả của tập lệnh này đã công bố nó dưới dạng mã nguồn mở, để các nhà giao dịch có thể xem xét và xác minh chức năng. Chúc mừng tác giả! Mặc dù bạn có thể sử dụng miễn phí, hãy nhớ rằng việc công bố lại mã phải tuân theo Nội quy.
Get access to 11 closed indicators
t.me/trade_lexx
t.me/trade_lexx
Thông báo miễn trừ trách nhiệm
Thông tin và các ấn phẩm này không nhằm mục đích, và không cấu thành, lời khuyên hoặc khuyến nghị về tài chính, đầu tư, giao dịch hay các loại khác do TradingView cung cấp hoặc xác nhận. Đọc thêm tại Điều khoản Sử dụng.