OPEN-SOURCE SCRIPT
Chanpreet RSI(3) Extreme Rays (4H, Adjustable Style)
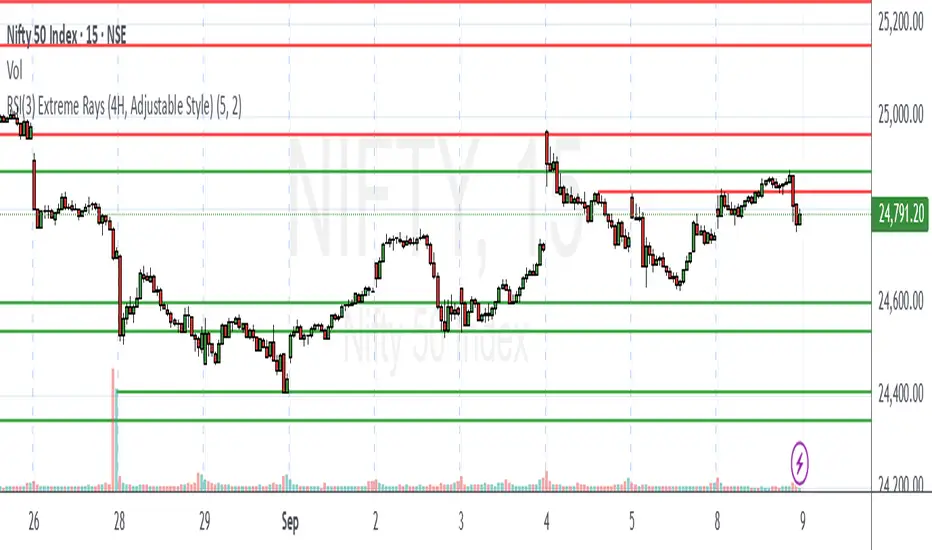
Chanpreet RSI(3) Extreme Rays (4H)
This indicator applies a short-length RSI (3) on the 4-hour timeframe and highlights momentum extremes directly on the chart.
🔎 What it does
Detects when RSI(3) moves into overbought (>80) or oversold (<20) territory.
Groups consecutive candles inside these zones into one “event” instead of marking each bar individually.
For each event:
• In overbought → records the highest high of the stretch and marks it with a horizontal ray.
• In oversold → records the lowest low of the stretch and marks it with a horizontal ray.
Keeps only the most recent N rays (default 5, adjustable).
⚙️ Inputs
Max Rays to Keep → how many unique events are kept visible.
Ray Thickness → adjust line thickness.
Overbought Ray Color → default red.
Oversold Ray Color → default green.
📈 How to use
Apply on any chart; RSI(3) values are always calculated from 4H data (via request.security).
Use rays as reference levels that highlight recent momentum extremes or exhaustion zones.
This is not a buy/sell signal by itself — combine with your own analysis, confirmation tools, and risk management.
Best Recommended time frame is 5 mins, 10 mins & 15 mins for intraday trading.
🧩 Unique features
Groups multiple bars into a single clean ray, reducing clutter.
Uses 4H RSI(3) regardless of the chart’s active timeframe.
Fully customizable appearance (colors, thickness, max events).
⚠️ Disclaimer
This script is provided for educational and informational purposes only.
It does not constitute financial advice or guarantee performance.
Always test thoroughly and use proper risk management before trading live.
Mã nguồn mở
Theo đúng tinh thần TradingView, tác giả của tập lệnh này đã công bố nó dưới dạng mã nguồn mở, để các nhà giao dịch có thể xem xét và xác minh chức năng. Chúc mừng tác giả! Mặc dù bạn có thể sử dụng miễn phí, hãy nhớ rằng việc công bố lại mã phải tuân theo Nội quy.
Thông báo miễn trừ trách nhiệm
Thông tin và các ấn phẩm này không nhằm mục đích, và không cấu thành, lời khuyên hoặc khuyến nghị về tài chính, đầu tư, giao dịch hay các loại khác do TradingView cung cấp hoặc xác nhận. Đọc thêm tại Điều khoản Sử dụng.