OPEN-SOURCE SCRIPT
Cập nhật BB With Buy & Sell Signaling by mattzab

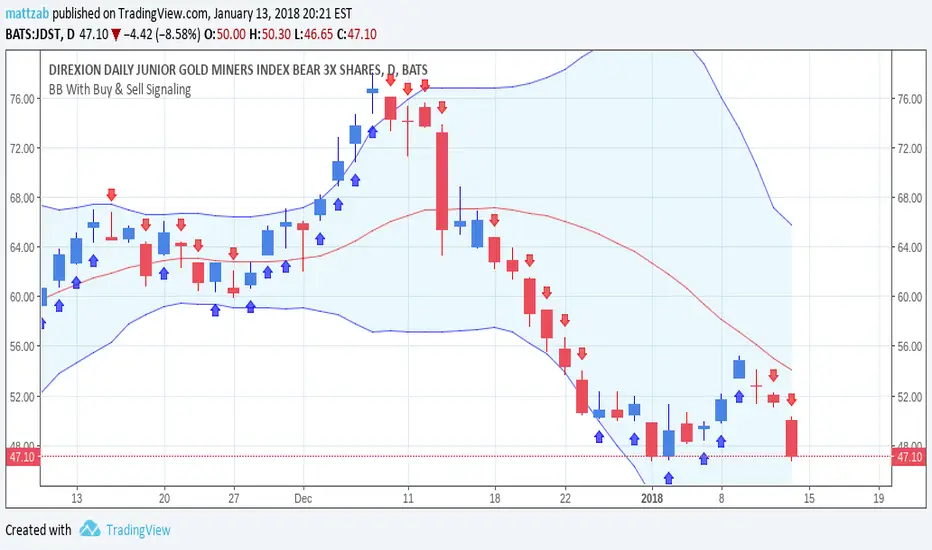
This is an unmodified Bollinger Band, with the addition of buy/sell arrows.
No arrow = hold the position (whether in or out)
Blue up = buy
Red down = sell
Arrows are produced by MACD histogram moving in the same direction as price.
MACD settings are:
Fast EMA = 10
Slow EMA = 20
Signal Smoothing SMA = 5
No arrow = hold the position (whether in or out)
Blue up = buy
Red down = sell
Arrows are produced by MACD histogram moving in the same direction as price.
MACD settings are:
Fast EMA = 10
Slow EMA = 20
Signal Smoothing SMA = 5
Phát hành các Ghi chú
Cleaned up and commented code.Phát hành các Ghi chú
Changed from Close Price to Average of High & Low Point.Phát hành các Ghi chú
Removed more whiplash. Modified some stuff regarding close, hl2, and hlc3. The buy/sell points seem to be more accurate now.If someone can show me how to prevent multiple consecutive buy arrows and sell arrows I'd appreciate it. Fewer arrows would be nice. Just a single buy, followed by a single sell, followed by a single buy, single sell, etc.
Email me, my username at gmail. Thanks!
Phát hành các Ghi chú
Cleaned up the arrows so there are fewer consecutive signals.Phát hành các Ghi chú
Cleaned up the arrows more. Now you should almost always only get a buy signal if the last signal was a sell, and only get a sell if previous signal was a buy. Not sure fire, but should work in most cases.Phát hành các Ghi chú
Added a blue and red line out in front of price to show how close the next signal is.Full Explanation:
This will overlay standard Bollinger Bands, with these additions:
Blue Up Arrow - Buy Signal
Red Down Arrow - Sell Signal
To the right of the current price:
Horizontal Blue and Red Lines - These show you how close you are to getting the opposite signal. When blue is above red, you are in buy/hold territory. When blue is below red, you are in sell/wait territory. The purpose of these red and blue horizontal lines out in front of price is to show you how close you are to getting an opposite buy/sell signal.
Phát hành các Ghi chú
Removed previous changes: not functioning properly. Code commented. Fix if you can figure out how. Email me the fix. My username at gmail.Phát hành các Ghi chú
This script now produces Standard Bollinger Bands, Buy/Sell arrows based on the 10,20,5 MACD Histogram (using high/low/close average) direction in relation to Price high/low average, and tack lines that indicate how close the next arrow is to coming around.The script isn't perfect, but I don't know what to do to get the tack lines to the right of price to be more accurate to the buy/sell arrows.
Email me if you have any ideas.
Phát hành các Ghi chú
Minor Tweaks for accuracy on the tack marks. Still needs improvement for better accuracy, email me if you can figure out the math I'm missing.Mã nguồn mở
Theo đúng tinh thần TradingView, tác giả của tập lệnh này đã công bố nó dưới dạng mã nguồn mở, để các nhà giao dịch có thể xem xét và xác minh chức năng. Chúc mừng tác giả! Mặc dù bạn có thể sử dụng miễn phí, hãy nhớ rằng việc công bố lại mã phải tuân theo Nội quy.
Thông báo miễn trừ trách nhiệm
Thông tin và các ấn phẩm này không nhằm mục đích, và không cấu thành, lời khuyên hoặc khuyến nghị về tài chính, đầu tư, giao dịch hay các loại khác do TradingView cung cấp hoặc xác nhận. Đọc thêm tại Điều khoản Sử dụng.
Mã nguồn mở
Theo đúng tinh thần TradingView, tác giả của tập lệnh này đã công bố nó dưới dạng mã nguồn mở, để các nhà giao dịch có thể xem xét và xác minh chức năng. Chúc mừng tác giả! Mặc dù bạn có thể sử dụng miễn phí, hãy nhớ rằng việc công bố lại mã phải tuân theo Nội quy.
Thông báo miễn trừ trách nhiệm
Thông tin và các ấn phẩm này không nhằm mục đích, và không cấu thành, lời khuyên hoặc khuyến nghị về tài chính, đầu tư, giao dịch hay các loại khác do TradingView cung cấp hoặc xác nhận. Đọc thêm tại Điều khoản Sử dụng.