OPEN-SOURCE SCRIPT
Mr. Laz's Fibonacci MA
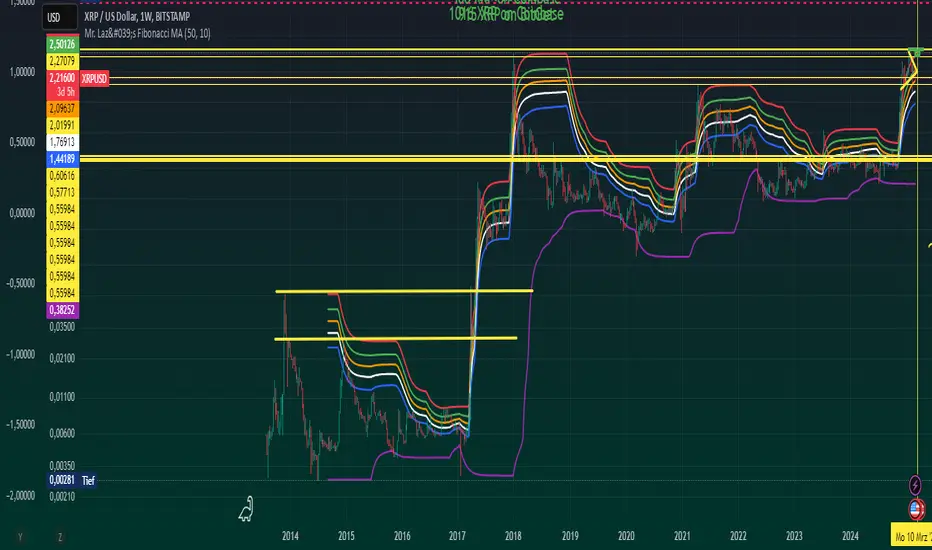
Smoothed Fibonacci Moving Average
This indicator plots six Fibonacci retracement levels overlaid on the chart, with each level smoothly adjusted using an Exponential Moving Average (EMA). The Fibonacci levels are calculated based on the highest high and lowest low over a user-defined period, and they represent key support and resistance zones that traders often watch for price reversals.
The six Fibonacci retracement levels plotted are:
0% (Fib 0): Top level (representing the highest point in the range).
23.6% (Fib 23.6%)
38.2% (Fib 38.2%)
50% (Fib 50%)
61.8% (Fib 61.8%)
100% (Fib 100): Bottom level (representing the lowest point in the range).
These levels are smoothed using a user-defined Smoothing Length, which helps reduce the "zig-zag" nature of the lines and provides a more gradual, smoother appearance as they follow the price movement. The indicator allows you to adjust the smoothing factor to control how sensitive the lines are to price changes.
The colors of the Fibonacci levels are customizable and are plotted from top to bottom as:
Red (for Fib 100%)
Green (for Fib 23.6%)
Orange (for Fib 38.2%)
White (for Fib 50%)
Blue (for Fib 61.8%)
Purple (for Fib 0%)
This indicator is useful for identifying key support and resistance zones based on Fibonacci retracement levels, with the added benefit of smoothing to make the lines more visually appealing and less prone to sudden shifts.
Mã nguồn mở
Theo đúng tinh thần TradingView, tác giả của tập lệnh này đã công bố nó dưới dạng mã nguồn mở, để các nhà giao dịch có thể xem xét và xác minh chức năng. Chúc mừng tác giả! Mặc dù bạn có thể sử dụng miễn phí, hãy nhớ rằng việc công bố lại mã phải tuân theo Nội quy.
Thông báo miễn trừ trách nhiệm
Thông tin và các ấn phẩm này không nhằm mục đích, và không cấu thành, lời khuyên hoặc khuyến nghị về tài chính, đầu tư, giao dịch hay các loại khác do TradingView cung cấp hoặc xác nhận. Đọc thêm tại Điều khoản Sử dụng.