OPEN-SOURCE SCRIPT
[S] Rolling Trendline
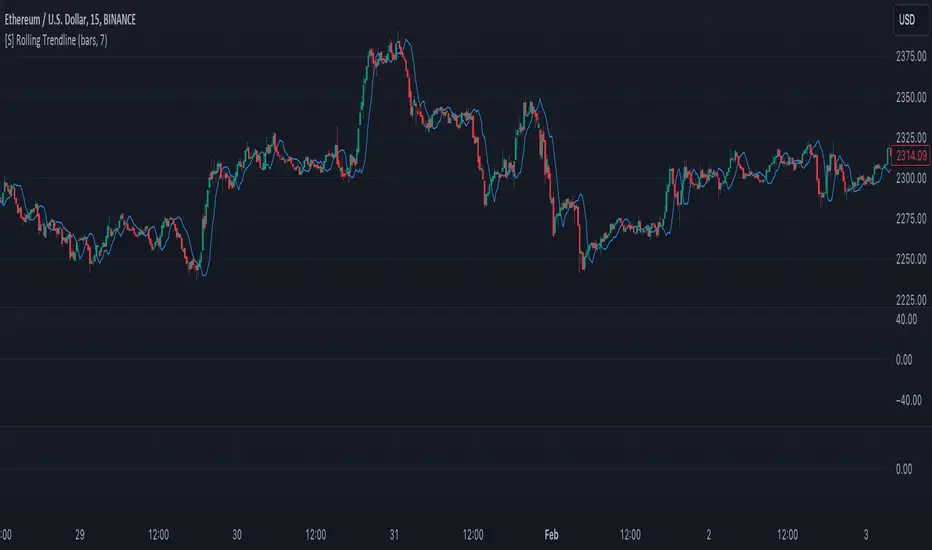
The Rolling Linear Regression Trendline is a sophisticated technical analysis tool designed to offer traders a dynamic view of market trends over a selectable period. This indicator employs linear regression to calculate and plot a trendline that best fits the closing prices within a specified window, either defined by a number of bars or a set period in days, independent of the chart's timeframe.
Key Features:
Dynamic Window Selection: Users can choose the calculation window based on a fixed number of bars or days, providing flexibility to adapt to different trading strategies and timeframes. For the 'days' option, the indicator calculates the equivalent number of bars based on the chart's timeframe, ensuring relevance across various market conditions and trading sessions.
Linear Regression Analysis: At its core, the indicator uses linear regression to identify the trend direction by calculating the slope and intercept of the trendline. This method offers a statistical approach to trend analysis, highlighting potential uptrends or downtrends based on the positioning and direction of the trendline.
Customizable Period: Traders can input their desired period (N), allowing for tailored analysis. Whether it's short-term movements or longer-term trends, the indicator can adjust to focus on specific time horizons, enhancing its utility across different trading styles and objectives.
Applications:
Trend Identification: By plotting a trendline that mathematically fits the closing prices over the chosen period, traders can quickly identify the prevailing market trend, aiding in bullish or bearish decision-making.
Support and Resistance: The trendline can also serve as a dynamic level of support or resistance, offering potential entry or exit points based on the price's interaction with the trendline.
Strategic Planning: With the ability to adjust the calculation window, traders can align the indicator with their trading strategy, whether focusing on intraday movements or broader swings.
Using this indicator with other parameters can widen you view of the market and help identifying trends
Mã nguồn mở
Theo đúng tinh thần TradingView, tác giả của tập lệnh này đã công bố nó dưới dạng mã nguồn mở, để các nhà giao dịch có thể xem xét và xác minh chức năng. Chúc mừng tác giả! Mặc dù bạn có thể sử dụng miễn phí, hãy nhớ rằng việc công bố lại mã phải tuân theo Nội quy.
Thông báo miễn trừ trách nhiệm
Thông tin và các ấn phẩm này không nhằm mục đích, và không cấu thành, lời khuyên hoặc khuyến nghị về tài chính, đầu tư, giao dịch hay các loại khác do TradingView cung cấp hoặc xác nhận. Đọc thêm tại Điều khoản Sử dụng.