OPEN-SOURCE SCRIPT
Last Freemans Ver1
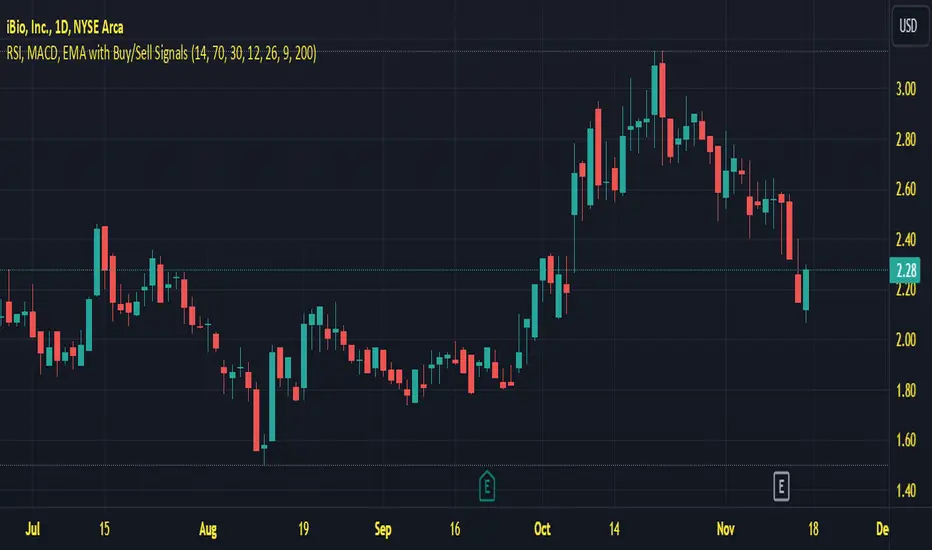
This script is a technical indicator for TradingView that combines three popular tools for analyzing price movements:
Relative Strength Index (RSI): This measures the momentum of recent price changes and indicates potential overbought or oversold conditions. The script allows you to adjust the RSI length (default 14) and define overbought (default 70) and oversold (default 30) levels.
Moving Average Convergence Divergence (MACD): This indicator helps identify trend direction and potential turning points. It uses two moving averages (fast and slow) and a signal line. The script lets you customize the lengths of the MACD lines (fast: 12, slow: 26, signal: 9).
Exponential Moving Average (EMA): This is a smoothing indicator used to identify the underlying trend by filtering out price noise. You can adjust the EMA length (default 200) in the script.
Additionally, the script generates Buy/Sell signals based on the following conditions:
Buy Signal:
MACD line crosses above the signal line (indicating a potential uptrend).
RSI is below the oversold level (suggesting room for price increase).
Closing price is below the EMA (potentially indicating a price pullback before an upswing).
Sell Signal:
MACD line crosses below the signal line (indicating a potential downtrend).
RSI is above the overbought level (suggesting potential for a price decrease).
Closing price is above the EMA (potentially indicating a price breakout before a decline).
Visualization:
The script plots the following on the chart:
RSI line (blue) with overbought and oversold levels as dashed lines (red and green, respectively).
MACD line (red) and signal line (blue).
EMA line (orange).
Green triangle up (below the bar) for Buy signals.
Red triangle down (above the bar) for Sell signals.
Important Note:
This script provides trading signals based on technical indicators, but keep in mind that these are not guaranteed predictions of future price movements. Always conduct your own research and consider other factors before making trading decisions.
Mã nguồn mở
Theo đúng tinh thần TradingView, tác giả của tập lệnh này đã công bố nó dưới dạng mã nguồn mở, để các nhà giao dịch có thể xem xét và xác minh chức năng. Chúc mừng tác giả! Mặc dù bạn có thể sử dụng miễn phí, hãy nhớ rằng việc công bố lại mã phải tuân theo Nội quy.
Thông báo miễn trừ trách nhiệm
Thông tin và các ấn phẩm này không nhằm mục đích, và không cấu thành, lời khuyên hoặc khuyến nghị về tài chính, đầu tư, giao dịch hay các loại khác do TradingView cung cấp hoặc xác nhận. Đọc thêm tại Điều khoản Sử dụng.