INVITE-ONLY SCRIPT
SFC Smart Money - Volatility
In statistics, a normal distribution is a type of continuous probability distribution for a real-valued random variable. Normal distributions are important in statistics and are often used in the natural and social sciences to represent real-valued random variables whose distributions are not known.
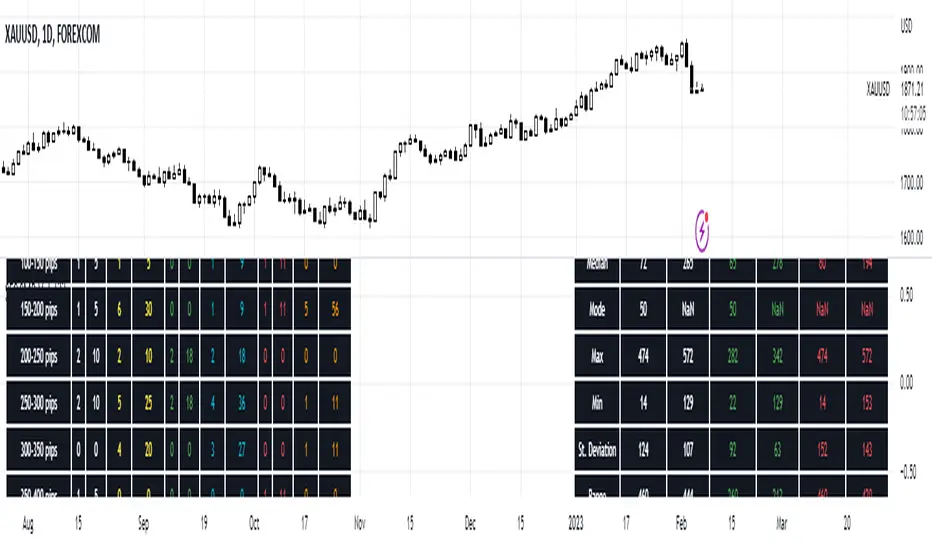
The indicator provide a deep statistic for the specified period. It calculate the normal distribution of all candles in the particular period, in order to measure the volatility and the probabilities. Also it separate bull from bear candles and calculate the normal distribution of each group. The calculations are mode based on open-open data and high-low data.
Volatility
Volatility is a statistical measure of the dispersion of returns for a given security or market index. In most cases, the higher the volatility , the riskier the security. Volatility is often measured from either the standard deviation or variance between returns from that same security or market index.
Volatility often refers to the amount of uncertainty or risk related to the size of changes in a security's value. A higher volatility means that a security's value can potentially be spread out over a larger range of values. This means that the price of the security can change dramatically over a short time period in either direction. A lower volatility means that a security's value does not fluctuate dramatically, and tends to be more steady.
While variance captures the dispersion of returns around the mean of an asset in general, volatility is a measure of that variance bounded by a specific period of time. Thus, we can report daily volatility , weekly, monthly, or annualized volatility .
This statistic gives very accurate information how the price moved in the past and what are normal movements and spikes. From this information, a future actions can be taken.
For better understanding, all data is calculated in pips.
Features:
- Mean - Mean is the one we are most used to, i.e. the average.
- Median -Sometimes, the data set values can have a few values which are at the extreme ends, and this might cause the mean of the data set to portray an incorrect picture.
Thus, we use the median, which gives the middle value of the sorted data set.
- Mode - In a given dataset, the mode will be the number which is occurring the most.
- Max - Maximum volatility for a given range.
- Min - Minimum volatility for a given range.
- Standard Deviation - The standard deviation tells us how far the value deviates from the mean.
- Range - Range simply gives the difference between the min and max values of the data set.
- ATR - Average True Range measures volatility, taking into account any gaps in the price movement.
- Normal Distribution - The basic premise is that given a range of observations, it is found that most of the values center around the mean and within one standard deviation
away from the mean.
- Probability - probability of outcomes.
We all know that the banks and professional traders do not trade with charts, but with different statistical methods, math. models and macroeconomics. This statistical indicator shows one of these methods.
It is recommended to use the indicator on daily timeframe . It also works on other timeframes, for example 1H for intraday analysis.
For more information how the normal distribution works, please search in internet.
Tập lệnh chỉ hiển thị cho người được mời
Quyền truy cập vào tập lệnh này bị hạn chế đối với người dùng được tác giả ủy quyền và thường yêu cầu thanh toán. Bạn có thể thêm nó vào mục yêu thích của mình, nhưng bạn sẽ chỉ có thể sử dụng nó sau khi yêu cầu sự cho phép từ tác giả. Liên hệ SerpentForexClub để thêm thông tin, hoặc làm theo hướng dẫn của tác giả bên dưới.
TradingView gợi ý bạn không trả tiền để sử dụng tập lệnh trừ khi bạn tin tưởng 100% vào tác giả của tập lệnh và hiểu cách hoạt động của tập lệnh. Trong nhiều trường hợp, bạn có thể tìm thấy giải pháp thay thế nguồn mở tốt miễn phí trong Tập lệnh cộng đồng của chúng tôi.
Hướng dẫn của tác giả
″Contact me through PM system.
Bạn muốn sử dụng tập lệnh này trên biểu đồ?
Cảnh báo: vui lòng đọc trước khi yêu cầu quyền truy cập.
Thông báo miễn trừ trách nhiệm
Thông tin và ấn phẩm không có nghĩa là và không cấu thành, tài chính, đầu tư, kinh doanh, hoặc các loại lời khuyên hoặc khuyến nghị khác được cung cấp hoặc xác nhận bởi TradingView. Đọc thêm trong Điều khoản sử dụng.