OPEN-SOURCE SCRIPT
Bollingers Bands Fibonacci ratios_copy of FOMO
Bollinger Bands Fibonacci Ratios (FiBB)
This TradingView script is a powerful tool that combines the classic Bollinger Bands with Fibonacci ratios to help traders identify potential support and resistance zones based on market volatility.
Key Features:
Dynamic Fibonacci Levels: The script calculates additional levels around a Simple Moving Average (SMA) using Fibonacci ratios (default: 1.618, 2.618, and 4.236). These levels adapt to market volatility using the Average True Range (ATR).
Customizable Parameters: Users can modify the length of the SMA and the Fibonacci ratios to fit their trading strategy and time frame.
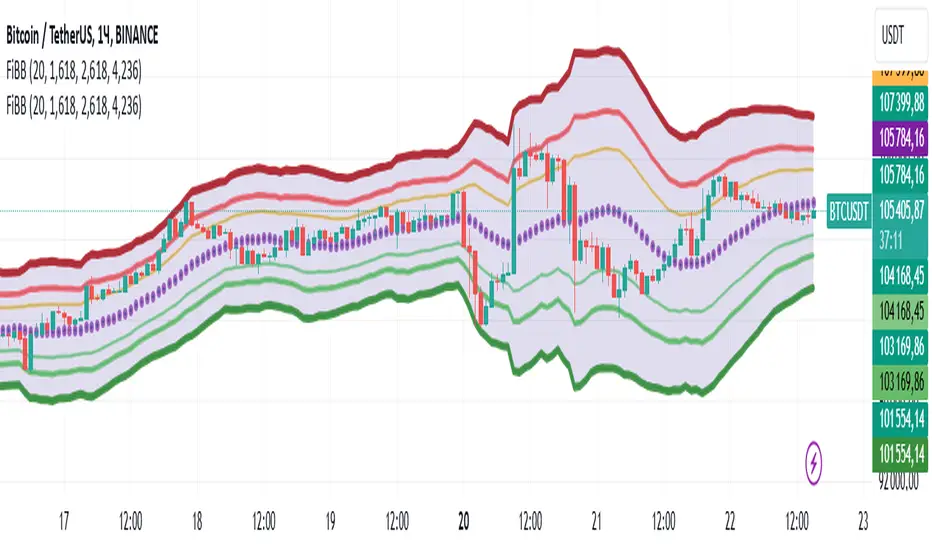
Visual Representation: The indicator plots three upper and three lower bands, with color-coded transparency for easy interpretation.
Central SMA Line: The core SMA line provides a baseline for price movement and trend direction.
Shaded Range: The script visually fills the area between the outermost bands to highlight the overall range of price action.
How to Use:
Use the upper bands as potential resistance zones and the lower bands as potential support zones.
Look for price interactions with these levels to identify opportunities for breakout, trend continuation, or reversal trades.
Combine with other indicators or price action analysis to enhance decision-making.
This script is ideal for traders who want a unique blend of Fibonacci-based analysis and Bollinger Bands to better navigate market movements.
This TradingView script is a powerful tool that combines the classic Bollinger Bands with Fibonacci ratios to help traders identify potential support and resistance zones based on market volatility.
Key Features:
Dynamic Fibonacci Levels: The script calculates additional levels around a Simple Moving Average (SMA) using Fibonacci ratios (default: 1.618, 2.618, and 4.236). These levels adapt to market volatility using the Average True Range (ATR).
Customizable Parameters: Users can modify the length of the SMA and the Fibonacci ratios to fit their trading strategy and time frame.
Visual Representation: The indicator plots three upper and three lower bands, with color-coded transparency for easy interpretation.
Central SMA Line: The core SMA line provides a baseline for price movement and trend direction.
Shaded Range: The script visually fills the area between the outermost bands to highlight the overall range of price action.
How to Use:
Use the upper bands as potential resistance zones and the lower bands as potential support zones.
Look for price interactions with these levels to identify opportunities for breakout, trend continuation, or reversal trades.
Combine with other indicators or price action analysis to enhance decision-making.
This script is ideal for traders who want a unique blend of Fibonacci-based analysis and Bollinger Bands to better navigate market movements.
Mã nguồn mở
Theo đúng tinh thần TradingView, tác giả của tập lệnh này đã công bố nó dưới dạng mã nguồn mở, để các nhà giao dịch có thể xem xét và xác minh chức năng. Chúc mừng tác giả! Mặc dù bạn có thể sử dụng miễn phí, hãy nhớ rằng việc công bố lại mã phải tuân theo Nội quy.
Thông báo miễn trừ trách nhiệm
Thông tin và các ấn phẩm này không nhằm mục đích, và không cấu thành, lời khuyên hoặc khuyến nghị về tài chính, đầu tư, giao dịch hay các loại khác do TradingView cung cấp hoặc xác nhận. Đọc thêm tại Điều khoản Sử dụng.