NQ Key Levels Map
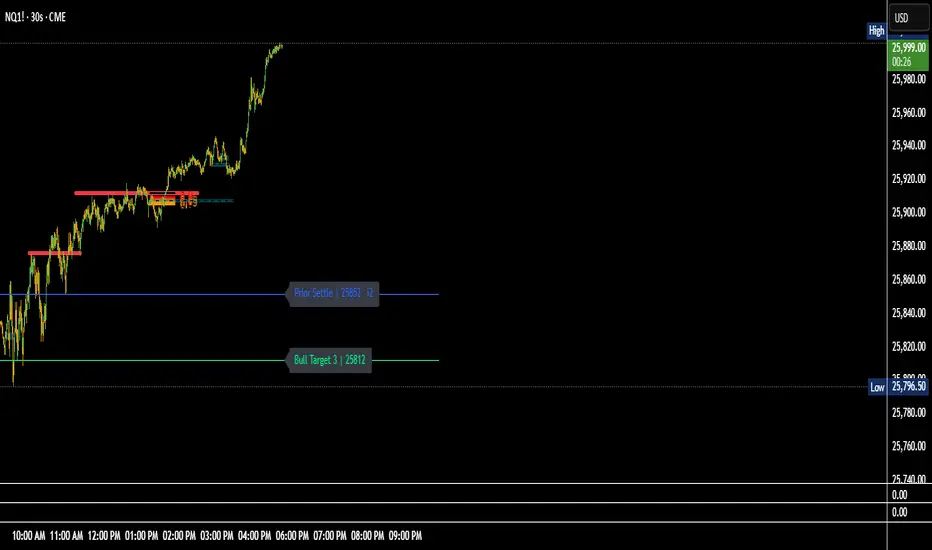
This indicator helps traders maintain spatial awareness of critical price zones throughout the session without cluttering the chart.
💡 Key Features:
🟩 Bullish Levels (Green)
Max ATM – highest key level or equilibrium pivot.
Bull Trigger – upside breakout or entry confirmation.
Bull Targets 1–3 – progressive profit targets for bullish continuation.
🟥 Bearish Levels (Red)
Min ATM – lowest key level or equilibrium pivot.
Bear Trigger – downside breakout or short confirmation.
Bear Targets 1–3 – progressive downside objectives.
Overnight Low – prior session low reference.
🟦 Contextual Levels (Blue)
Overnight High – prior session high reference.
Flip Area – inflection zone where sentiment can shift.
Prior Settle – yesterday’s settlement price anchor.
Tập lệnh chỉ hiển thị cho người được mời
Chỉ những người dùng được tác giả chấp thuận mới có thể truy cập tập lệnh này. Bạn sẽ cần yêu cầu và được cấp quyền sử dụng. Thông thường quyền này được cấp sau khi thanh toán. Để biết thêm chi tiết, làm theo hướng dẫn của tác giả bên dưới hoặc liên hệ trực tiếp với crptoworthy.
TradingView KHÔNG khuyến nghị bạn trả phí hoặc sử dụng một tập lệnh trừ khi bạn hoàn toàn tin tưởng vào tác giả và hiểu cách hoạt động của tập lệnh. Bạn cũng có thể tìm các lựa chọn miễn phí, mã nguồn mở trong các script cộng đồng của chúng tôi.
Hướng dẫn của tác giả
Thông báo miễn trừ trách nhiệm
Tập lệnh chỉ hiển thị cho người được mời
Chỉ những người dùng được tác giả chấp thuận mới có thể truy cập tập lệnh này. Bạn sẽ cần yêu cầu và được cấp quyền sử dụng. Thông thường quyền này được cấp sau khi thanh toán. Để biết thêm chi tiết, làm theo hướng dẫn của tác giả bên dưới hoặc liên hệ trực tiếp với crptoworthy.
TradingView KHÔNG khuyến nghị bạn trả phí hoặc sử dụng một tập lệnh trừ khi bạn hoàn toàn tin tưởng vào tác giả và hiểu cách hoạt động của tập lệnh. Bạn cũng có thể tìm các lựa chọn miễn phí, mã nguồn mở trong các script cộng đồng của chúng tôi.