Megalodon Pro Automated Shorter Term Trader
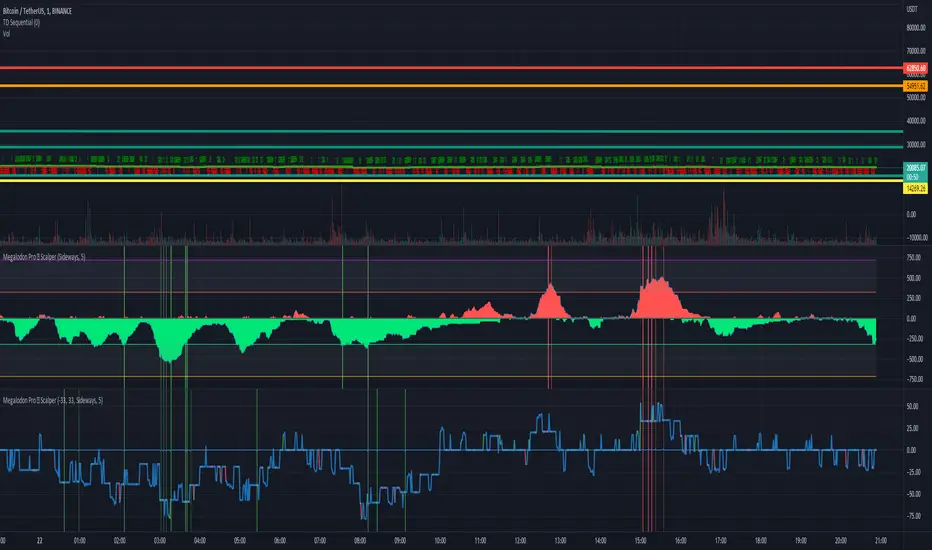
- Green cloud shows the total buy signals. Red cloud shows the total sell signals.
- Yellow line shows the difference between buy and sell signals. If yellow line is above 0, we have more SELL signals than BUY signals. If yellow line is below 0, we have more BUY signals than SELL signals.
- You should basically compare the red cloud with the green cloud to enter or exit in a trade.
- It should be used on shorter time frames. I recommend using 1 minute or 15 minute for better analysis.
- It prints Green for Buy - Orange for Strong Buy- Red for Sell - Purple for Strong Sell signals.
- This indicator basically looks for many different indicators' setups and shows you exactly what you need to know.
- You may also set alarms for 4 different signals including Buy - Strong Buy - Strong Sell - Sell
Tập lệnh chỉ hiển thị cho người được mời
Chỉ những người dùng được tác giả chấp thuận mới có thể truy cập tập lệnh này. Bạn sẽ cần yêu cầu và được cấp quyền sử dụng. Thông thường quyền này được cấp sau khi thanh toán. Để biết thêm chi tiết, làm theo hướng dẫn của tác giả bên dưới hoặc liên hệ trực tiếp với MegalodonTrading.
TradingView KHÔNG khuyến nghị bạn trả phí hoặc sử dụng một tập lệnh trừ khi bạn hoàn toàn tin tưởng vào tác giả và hiểu cách hoạt động của tập lệnh. Bạn cũng có thể tìm các lựa chọn miễn phí, mã nguồn mở trong các script cộng đồng của chúng tôi.
Hướng dẫn của tác giả
Thông báo miễn trừ trách nhiệm
Tập lệnh chỉ hiển thị cho người được mời
Chỉ những người dùng được tác giả chấp thuận mới có thể truy cập tập lệnh này. Bạn sẽ cần yêu cầu và được cấp quyền sử dụng. Thông thường quyền này được cấp sau khi thanh toán. Để biết thêm chi tiết, làm theo hướng dẫn của tác giả bên dưới hoặc liên hệ trực tiếp với MegalodonTrading.
TradingView KHÔNG khuyến nghị bạn trả phí hoặc sử dụng một tập lệnh trừ khi bạn hoàn toàn tin tưởng vào tác giả và hiểu cách hoạt động của tập lệnh. Bạn cũng có thể tìm các lựa chọn miễn phí, mã nguồn mở trong các script cộng đồng của chúng tôi.