OPEN-SOURCE SCRIPT
Rolling ATR Bands | Flux Charts
💎GENERAL OVERVIEW
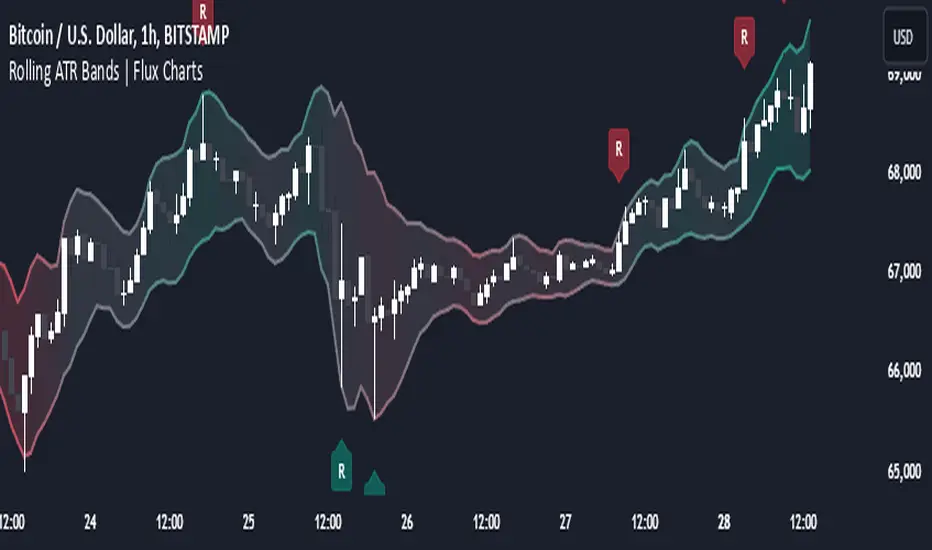
Introducing the Rolling ATR Bands indicator! This indicator overlays adaptive bands around the price, using the Average True Range (ATR) to define dynamic support and resistance levels. The Rolling ATR Bands are color-coded to visually indicate potential trend strength, shifting between bearish, neutral, and bullish colors. This tool can help traders interpret price volatility, as well as identify probable trend changes, continuations, or reversals. For more information about the process, check the "HOW DOES IT WORK ?" section.

Features of the new Rolling ATR Bands:
📌HOW DOES IT WORK?
The Rolling ATR Bands indicator calculates the ATR based on the specified length and multiplier to form upper and lower bands around the price. These bands adapt with market volatility, widening during high volatility and contracting during lower volatility periods.
In addition, the indicator calculates a "trend strength" score by combining an interpolated RSI, Supertrend, and EMA crossover. This score is smoothed with a customizable length, and a color gradient is applied to visually denote the strength of bearish, neutral, or bullish conditions.
Here's how to interpret the bands:
Upper Band: Acts as dynamic resistance; when price approaches or touches it, this often suggests potential overbought conditions.
Lower Band: Acts as dynamic support; touching or nearing this band might indicate potential oversold conditions.
Color Shifts: Color changes indicate shifts in trend direction. For example, a green color suggests a bullish trend, while red hints at bearish tendencies.

🚩UNIQUENESS
What sets the Rolling ATR Bands apart is the combined use of interpolated RSI, Supertrend, and EMA cross values, creating a weighted trend strength score. This integration allows for nuanced, color-coded visual cues that respond quickly to trend changes without excessive noise, offering traders an intuitive view of both trend direction and potential momentum. You can also set up alerts for retest & alerts for upper and lower bands to get informed of potential movements.

⚙️SETTINGS
1. General Configuration
ATR Length : Controls the ATR calculation length for the bands.
Smoothing: Adjusts the trend strength smoothing to control sensitivity to trend changes.
ATR Multiplier : Sets the width of the bands by multiplying the ATR value.
Trend Smoothing : Higher settings will result in longer periods of time required for trend to change direction from bullish to bearish and vice versa.
Introducing the Rolling ATR Bands indicator! This indicator overlays adaptive bands around the price, using the Average True Range (ATR) to define dynamic support and resistance levels. The Rolling ATR Bands are color-coded to visually indicate potential trend strength, shifting between bearish, neutral, and bullish colors. This tool can help traders interpret price volatility, as well as identify probable trend changes, continuations, or reversals. For more information about the process, check the "HOW DOES IT WORK ?" section.
Features of the new Rolling ATR Bands:
- ATR Bands With Customizable ATR Length & Multiplier
- Smooth Trend Strength With Adjustable Smoothing Options
- Color-coded bands Representing Bearish, Neutral, or Bullish Trends
- Alerts for Retests & Breaks
- Customizable Visuals
📌HOW DOES IT WORK?
The Rolling ATR Bands indicator calculates the ATR based on the specified length and multiplier to form upper and lower bands around the price. These bands adapt with market volatility, widening during high volatility and contracting during lower volatility periods.
In addition, the indicator calculates a "trend strength" score by combining an interpolated RSI, Supertrend, and EMA crossover. This score is smoothed with a customizable length, and a color gradient is applied to visually denote the strength of bearish, neutral, or bullish conditions.
Here's how to interpret the bands:
Upper Band: Acts as dynamic resistance; when price approaches or touches it, this often suggests potential overbought conditions.
Lower Band: Acts as dynamic support; touching or nearing this band might indicate potential oversold conditions.
Color Shifts: Color changes indicate shifts in trend direction. For example, a green color suggests a bullish trend, while red hints at bearish tendencies.
🚩UNIQUENESS
What sets the Rolling ATR Bands apart is the combined use of interpolated RSI, Supertrend, and EMA cross values, creating a weighted trend strength score. This integration allows for nuanced, color-coded visual cues that respond quickly to trend changes without excessive noise, offering traders an intuitive view of both trend direction and potential momentum. You can also set up alerts for retest & alerts for upper and lower bands to get informed of potential movements.
⚙️SETTINGS
1. General Configuration
ATR Length : Controls the ATR calculation length for the bands.
Smoothing: Adjusts the trend strength smoothing to control sensitivity to trend changes.
ATR Multiplier : Sets the width of the bands by multiplying the ATR value.
Trend Smoothing : Higher settings will result in longer periods of time required for trend to change direction from bullish to bearish and vice versa.
Mã nguồn mở
Theo đúng tinh thần TradingView, tác giả của tập lệnh này đã công bố nó dưới dạng mã nguồn mở, để các nhà giao dịch có thể xem xét và xác minh chức năng. Chúc mừng tác giả! Mặc dù bạn có thể sử dụng miễn phí, hãy nhớ rằng việc công bố lại mã phải tuân theo Nội quy.
Access Flux Charts' exclusive indicators: fluxcharts.com/
Join our Discord community: discord.gg/FluxCharts
Join our Discord community: discord.gg/FluxCharts
Thông báo miễn trừ trách nhiệm
Thông tin và các ấn phẩm này không nhằm mục đích, và không cấu thành, lời khuyên hoặc khuyến nghị về tài chính, đầu tư, giao dịch hay các loại khác do TradingView cung cấp hoặc xác nhận. Đọc thêm tại Điều khoản Sử dụng.