OPEN-SOURCE SCRIPT
Cập nhật Support & Resistance Parser
I've created a user-friendly trading indicator that interprets and visually presents support and resistance levels, transforming raw data into actionable insights.
Here's a glimpse of what you might encounter:
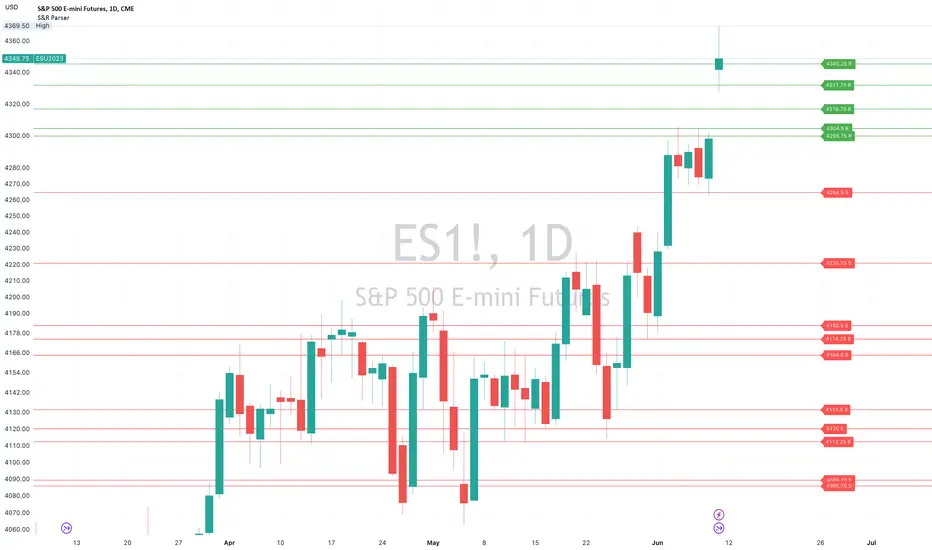
Today's trigger points (ES)
Support: 4264.5,4220.75,4131.5,4164.5,3980.75,4182.5,4174.25,4120,4112.25,4089.25,4085.75
Resistance: 4299.75,4304.5,4316.75,4345.25,4331.75
This is how it works:
1. Copy the series of support and resistance figures, ie just the comma separated numbers
2. Paste each series into their respective setting in the indicator.
3. The indicator parses the data, understanding the sequence and importance of each figure.
4. It then draws the corresponding support and resistance lines on your trading chart.
Chart would appear similar to the following:

This tool distinguishes itself with its user-friendly features. Each line comes with adjustable labels, enabling users to personalize their visualization. This makes the data more intuitive and easier to comprehend, enhancing decision-making during trades.
Note: The indicator includes limited error handling capabilities.
Make the most out of your trading journey with this intuitive and customizable tool, specifically designed to turn raw data into valuable trading insights.
Here's a glimpse of what you might encounter:
Today's trigger points (ES)
Support: 4264.5,4220.75,4131.5,4164.5,3980.75,4182.5,4174.25,4120,4112.25,4089.25,4085.75
Resistance: 4299.75,4304.5,4316.75,4345.25,4331.75
This is how it works:
1. Copy the series of support and resistance figures, ie just the comma separated numbers
2. Paste each series into their respective setting in the indicator.
3. The indicator parses the data, understanding the sequence and importance of each figure.
4. It then draws the corresponding support and resistance lines on your trading chart.
Chart would appear similar to the following:
This tool distinguishes itself with its user-friendly features. Each line comes with adjustable labels, enabling users to personalize their visualization. This makes the data more intuitive and easier to comprehend, enhancing decision-making during trades.
Note: The indicator includes limited error handling capabilities.
Make the most out of your trading journey with this intuitive and customizable tool, specifically designed to turn raw data into valuable trading insights.
Phát hành các Ghi chú
Updating ChartMã nguồn mở
Theo đúng tinh thần TradingView, tác giả của tập lệnh này đã công bố nó dưới dạng mã nguồn mở, để các nhà giao dịch có thể xem xét và xác minh chức năng. Chúc mừng tác giả! Mặc dù bạn có thể sử dụng miễn phí, hãy nhớ rằng việc công bố lại mã phải tuân theo Nội quy.
Thông báo miễn trừ trách nhiệm
Thông tin và các ấn phẩm này không nhằm mục đích, và không cấu thành, lời khuyên hoặc khuyến nghị về tài chính, đầu tư, giao dịch hay các loại khác do TradingView cung cấp hoặc xác nhận. Đọc thêm tại Điều khoản Sử dụng.
Mã nguồn mở
Theo đúng tinh thần TradingView, tác giả của tập lệnh này đã công bố nó dưới dạng mã nguồn mở, để các nhà giao dịch có thể xem xét và xác minh chức năng. Chúc mừng tác giả! Mặc dù bạn có thể sử dụng miễn phí, hãy nhớ rằng việc công bố lại mã phải tuân theo Nội quy.
Thông báo miễn trừ trách nhiệm
Thông tin và các ấn phẩm này không nhằm mục đích, và không cấu thành, lời khuyên hoặc khuyến nghị về tài chính, đầu tư, giao dịch hay các loại khác do TradingView cung cấp hoặc xác nhận. Đọc thêm tại Điều khoản Sử dụng.