OPEN-SOURCE SCRIPT
Cập nhật Statistical Pairs Trading Indicator
Z-Score Stat Trading — Statistical Pairs Trading Indicator
📊🔗
---
What is it?
Z-Score Stat Trading is a powerful indicator for statistical pairs trading and quantitative analysis of two correlated assets.
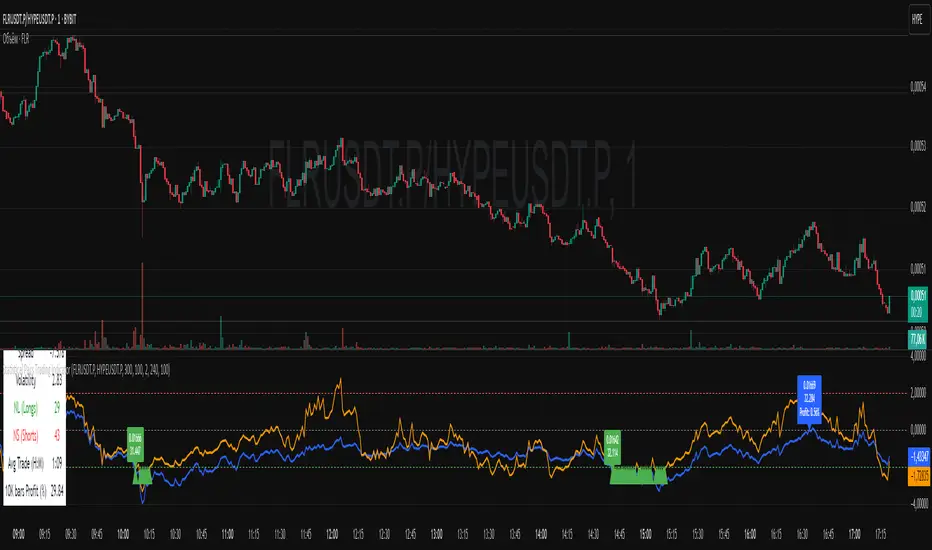
It calculates the Z-Score of the log-price spread between any two symbols you choose, providing both long-term and short-term Z-Score signals.
You’ll also see real-time correlation, volatility, spread, and the number of long/short signals in a handy on-chart table!
---
How to Use 🛠️
1. Add the indicator to your chart.
2. Select two assets (symbols) to analyze in the settings.
3. Watch the Z-Score plots (blue and orange lines) and threshold levels (+2, -2 by default).
4. Check the info table for:
- Correlation
- Volatility
- Spread
- Number of long (NL) and short (NS) signals in the last 1000 bars
5. Set up alerts for signal generation or threshold crossings if you want to be notified automatically.
---
Trading Strategy 💡
- This indicator is designed for statistical arbitrage (mean reversion) strategies.
- Long Signal (🟢):
When both Z-Scores drop below the negative threshold (e.g., -2), a long signal is generated.
→ Buy Symbol A, Sell Symbol B, expecting the spread to revert to the mean.
- Short Signal (🔴):
When both Z-Scores rise above the positive threshold (e.g., +2), a short signal is generated.
→ Sell Symbol A, Buy Symbol B, again expecting mean reversion.
- The info table helps you quickly assess the frequency of signals and the current statistical relationship between your chosen assets.
---
Best Practices & Warnings 🚦
- Avoid high leverage! Pairs trading can be risky, especially during periods of divergence. Use conservative position sizing.
- Check for cointegration: Before using this indicator, make sure both assets are cointegrated or have a strong historical relationship. This increases the reliability of mean reversion signals.
- Check correlation: Only use asset pairs with a high correlation (preferably 0.8–0.9 or higher) for best results. The correlation value is shown in the info table.
- Scale in and out gradually: When entering or exiting positions, consider doing so in parts rather than all at once. This helps manage slippage and risk, especially in volatile markets.
---
⚠️ Note on Performance:
This indicator may work a bit slowly, especially on large timeframes or long chart histories, because the calculation of NL and NS (number of long/short signals) is computationally intensive.
---
Disclaimer ⚠️
This script is provided for educational and informational purposes only.
It is not financial advice or a recommendation to buy or sell any asset.
Use at your own risk. The author assumes no responsibility for any trading decisions or losses.
📊🔗
---
What is it?
Z-Score Stat Trading is a powerful indicator for statistical pairs trading and quantitative analysis of two correlated assets.
It calculates the Z-Score of the log-price spread between any two symbols you choose, providing both long-term and short-term Z-Score signals.
You’ll also see real-time correlation, volatility, spread, and the number of long/short signals in a handy on-chart table!
---
How to Use 🛠️
1. Add the indicator to your chart.
2. Select two assets (symbols) to analyze in the settings.
3. Watch the Z-Score plots (blue and orange lines) and threshold levels (+2, -2 by default).
4. Check the info table for:
- Correlation
- Volatility
- Spread
- Number of long (NL) and short (NS) signals in the last 1000 bars
5. Set up alerts for signal generation or threshold crossings if you want to be notified automatically.
---
Trading Strategy 💡
- This indicator is designed for statistical arbitrage (mean reversion) strategies.
- Long Signal (🟢):
When both Z-Scores drop below the negative threshold (e.g., -2), a long signal is generated.
→ Buy Symbol A, Sell Symbol B, expecting the spread to revert to the mean.
- Short Signal (🔴):
When both Z-Scores rise above the positive threshold (e.g., +2), a short signal is generated.
→ Sell Symbol A, Buy Symbol B, again expecting mean reversion.
- The info table helps you quickly assess the frequency of signals and the current statistical relationship between your chosen assets.
---
Best Practices & Warnings 🚦
- Avoid high leverage! Pairs trading can be risky, especially during periods of divergence. Use conservative position sizing.
- Check for cointegration: Before using this indicator, make sure both assets are cointegrated or have a strong historical relationship. This increases the reliability of mean reversion signals.
- Check correlation: Only use asset pairs with a high correlation (preferably 0.8–0.9 or higher) for best results. The correlation value is shown in the info table.
- Scale in and out gradually: When entering or exiting positions, consider doing so in parts rather than all at once. This helps manage slippage and risk, especially in volatile markets.
---
⚠️ Note on Performance:
This indicator may work a bit slowly, especially on large timeframes or long chart histories, because the calculation of NL and NS (number of long/short signals) is computationally intensive.
---
Disclaimer ⚠️
This script is provided for educational and informational purposes only.
It is not financial advice or a recommendation to buy or sell any asset.
Use at your own risk. The author assumes no responsibility for any trading decisions or losses.
Phát hành các Ghi chú
Z-Score Stat Trading — Statistical Pairs Trading Indicator📊🔗
---
What is it?
Z-Score Stat Trading is a powerful indicator for statistical pairs trading and quantitative analysis of two correlated assets.
It calculates the Z-Score of the log-price spread between any two symbols you choose, providing both long-term and short-term Z-Score signals.
You’ll also see real-time correlation, volatility, spread, and the number of long/short signals in a handy on-chart table!
---
How to Use 🛠️
1. Add the indicator to your chart.
2. Select two assets (symbols) to analyze in the settings.
3. Watch the Z-Score plots (blue and orange lines) and threshold levels (+2, -2 by default).
4. Check the info table for:
- Correlation
- Volatility
- Spread
- Number of long (NL) and short (NS) signals in the last 5000 bars
5. Set up alerts for signal generation or threshold crossings if you want to be notified automatically.
---
Trading Strategy 💡
- This indicator is designed for statistical arbitrage (mean reversion) strategies.
- Long Signal (🟢):
When both Z-Scores drop below the negative threshold (e.g., -2), a long signal is generated.
→ Buy Symbol A, Sell Symbol B, expecting the spread to revert to the mean.
- Short Signal (🔴):
When both Z-Scores rise above the positive threshold (e.g., +2), a short signal is generated.
→ Sell Symbol A, Buy Symbol B, again expecting mean reversion.
- The info table helps you quickly assess the frequency of signals and the current statistical relationship between your chosen assets.
---
Best Practices & Warnings 🚦
- Avoid high leverage! Pairs trading can be risky, especially during periods of divergence. Use conservative position sizing.
- Check for cointegration: Before using this indicator, make sure both assets are cointegrated or have a strong historical relationship. This increases the reliability of mean reversion signals.
- Check correlation: Only use asset pairs with a high correlation (preferably 0.8–0.9 or higher) for best results. The correlation value is shown in the info table.
- Scale in and out gradually: When entering or exiting positions, consider doing so in parts rather than all at once. This helps manage slippage and risk, especially in volatile markets.
---
⚠️ Note on Performance:
This indicator may work a bit slowly, especially on large timeframes or long chart histories, because the calculation of NL and NS (number of long/short signals) is computationally intensive.
---
Disclaimer ⚠️
This script is provided for educational and informational purposes only.
It is not financial advice or a recommendation to buy or sell any asset.
Use at your own risk. The author assumes no responsibility for any trading decisions or losses.
Phát hành các Ghi chú
🆕 Update Notes for Statistical Pairs Trading Indicator1. Correlation calculation improved
Pearson correlation between priceA and priceB is now calculated over a user-defined period (default: 240 bars).
2. Signal price labels added
Optionally display the prices of both assets at the moment a long or short signal appears.
3. Profit evaluation on zero-cross
Once both Z-score lines cross the zero level (even at different times), the indicator now displays exit prices and estimated profit percentage for the pair trade.
4. Total profit added over the last 10,000 bars
5. Readable trade duration
Average trade duration is now displayed in a clear hours:minutes format for better interpretability.
Mã nguồn mở
Theo đúng tinh thần TradingView, tác giả của tập lệnh này đã công bố nó dưới dạng mã nguồn mở, để các nhà giao dịch có thể xem xét và xác minh chức năng. Chúc mừng tác giả! Mặc dù bạn có thể sử dụng miễn phí, hãy nhớ rằng việc công bố lại mã phải tuân theo Nội quy.
Thông báo miễn trừ trách nhiệm
Thông tin và các ấn phẩm này không nhằm mục đích, và không cấu thành, lời khuyên hoặc khuyến nghị về tài chính, đầu tư, giao dịch hay các loại khác do TradingView cung cấp hoặc xác nhận. Đọc thêm tại Điều khoản Sử dụng.