OPEN-SOURCE SCRIPT
Cập nhật Ultimate Volume
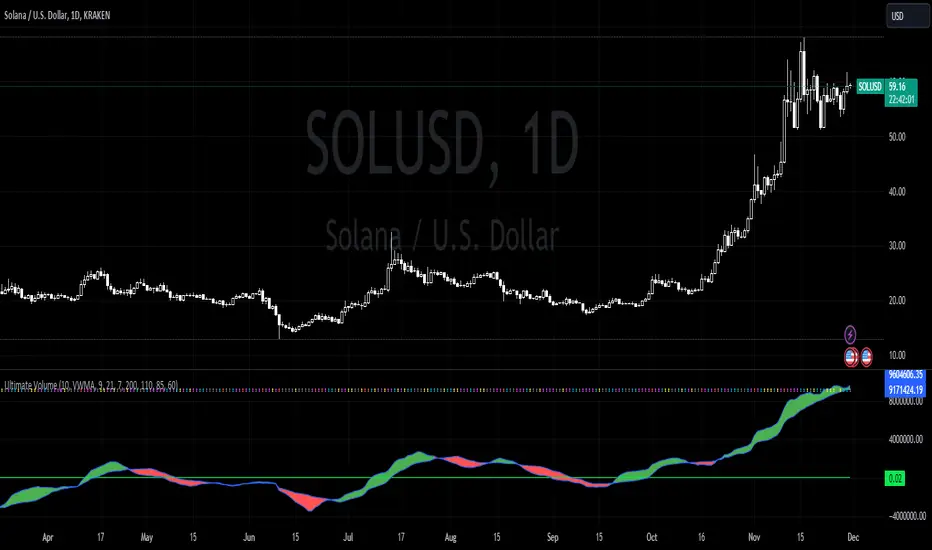
The Ultimate Volume indicator combines three volume calculations and plots each signal in a single indicator. Behold!
Relative Volume
an indicator that tells traders how current volume is compared to past trading volumes over a given period. It is kind of like a radar for how “in-play” a stock is. The higher the relative volume is, the more in play it is. Relative Volume is displayed as a ratio. So if it is showing 3.5 relative volume, that means it is trading at 3.5 times its normal volume.
Plotted as a green number on the chart
Trend Volume
An extension to "On Balance Volume Momentum (OBV Momentum)".
"OBV Trend" is a trend strength indicator, that can be used to identify strong trends and also trend changes based on volume.
High positive values indicate strong volume on the buy side, high negative values indicate strong volume on the sell side.
An increasing OBV trend indicates a strengthening buy trend or a weakening sell trend,
decreasing OBV trend indicates a strengthening sell trend or weakening buy trend.
OBV trend is calculated by plotting a short vs. a long moving average and filling the difference in volume.
Volume Arrows
As a general rule, when a stock goes up on low volume, it's seen as negative because it means buyers aren't committed. When a stock goes down on low volume, it means that not many people are trying to sell it, which is positive. The indicator calculates the average volume for the user selected lookback period. From there a ratio of the current volume vs the average volume is used to determine the candle’s colors.
Plots as colored arrows.
Red = Extreme Demand
Pink = High Demand
Aqua = Average Demand
Yellow = Light Demand
Grey = Dry Demand
Phát hành các Ghi chú
.Phát hành các Ghi chú
..Mã nguồn mở
Theo đúng tinh thần TradingView, tác giả của tập lệnh này đã công bố nó dưới dạng mã nguồn mở, để các nhà giao dịch có thể xem xét và xác minh chức năng. Chúc mừng tác giả! Mặc dù bạn có thể sử dụng miễn phí, hãy nhớ rằng việc công bố lại mã phải tuân theo Nội quy.
Thông báo miễn trừ trách nhiệm
Thông tin và các ấn phẩm này không nhằm mục đích, và không cấu thành, lời khuyên hoặc khuyến nghị về tài chính, đầu tư, giao dịch hay các loại khác do TradingView cung cấp hoặc xác nhận. Đọc thêm tại Điều khoản Sử dụng.
Mã nguồn mở
Theo đúng tinh thần TradingView, tác giả của tập lệnh này đã công bố nó dưới dạng mã nguồn mở, để các nhà giao dịch có thể xem xét và xác minh chức năng. Chúc mừng tác giả! Mặc dù bạn có thể sử dụng miễn phí, hãy nhớ rằng việc công bố lại mã phải tuân theo Nội quy.
Thông báo miễn trừ trách nhiệm
Thông tin và các ấn phẩm này không nhằm mục đích, và không cấu thành, lời khuyên hoặc khuyến nghị về tài chính, đầu tư, giao dịch hay các loại khác do TradingView cung cấp hoặc xác nhận. Đọc thêm tại Điều khoản Sử dụng.