OPEN-SOURCE SCRIPT
Cập nhật Price Variation and Projection Indicator
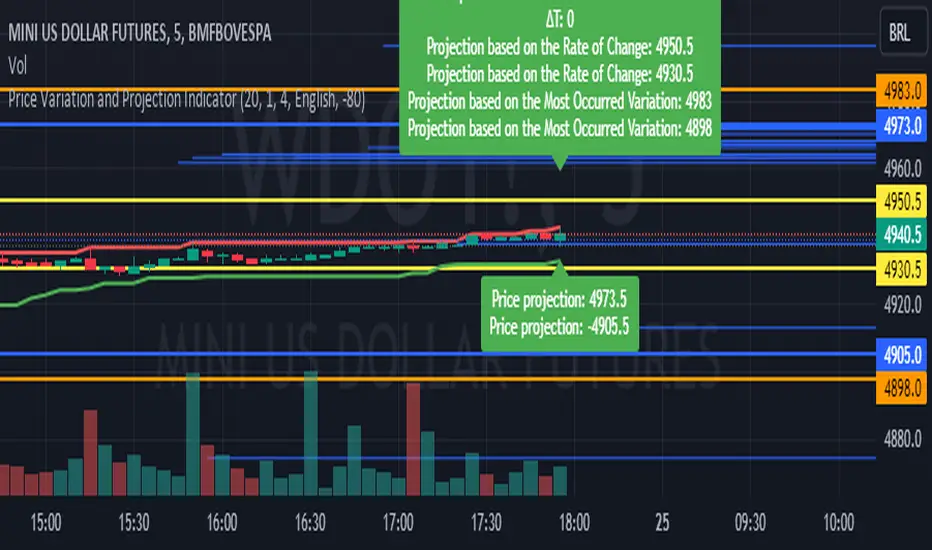
This indicator calculates and visualizes various aspects of price variation and projection based on certain parameters such as rate of change, time interval, constant value, and more. It helps traders understand potential price movements and provides insights into potential support and resistance levels.
The indicator displays the following information:
Resistance and support levels based on the highest and lowest prices over a specified period.
∆P (Price Variation) calculated between two high oscillations.
∆t (Time Variation) calculated between two high oscillations.
Price variation rate.
Price projections based on rate of change and the most occurred variation.
Additionally, parallel lines are drawn to illustrate projected price ranges, and the most frequent ∆P value is shown for reference.
in short the indicator does it projects possible support and resistance for you to add a mark for example you see that it gave a projection you mark it on the chart with horizontal line or horizontal ray you can configure it by Period or by ∆t calculation limit au increase the period it will increase the projection of all targets interesting periods to use 20 50 80 120 200 since the ∆t calculation limit au decrease increases the projection in the Price projection that is showing the information in blue color when increasing it decreases the projection target ∆t calculation interesting limit to use 3 4 6 7 8 9
it works for all timeframes can be used for Swing trade or day trade
use I like to use it with a closed market that helps me to trace possible support and resistance can be used with open market as well
Choose your preferred language to display the information
Please note that this indicator is designed for educational and informational purposes. Always conduct your own analysis and consider risk management strategies before making trading decisions.
Phát hành các Ghi chú
In this new version there have been visual improvements now when the projection that was in blue is more likely to happen the color turns green and there is a new multiplier functionality that multiplies the rate of variation occurring more times now the user can choose how many times he wants to multiply to provide possible longer resistance and support levelsMã nguồn mở
Theo đúng tinh thần TradingView, tác giả của tập lệnh này đã công bố nó dưới dạng mã nguồn mở, để các nhà giao dịch có thể xem xét và xác minh chức năng. Chúc mừng tác giả! Mặc dù bạn có thể sử dụng miễn phí, hãy nhớ rằng việc công bố lại mã phải tuân theo Nội quy.
Thông báo miễn trừ trách nhiệm
Thông tin và các ấn phẩm này không nhằm mục đích, và không cấu thành, lời khuyên hoặc khuyến nghị về tài chính, đầu tư, giao dịch hay các loại khác do TradingView cung cấp hoặc xác nhận. Đọc thêm tại Điều khoản Sử dụng.
Mã nguồn mở
Theo đúng tinh thần TradingView, tác giả của tập lệnh này đã công bố nó dưới dạng mã nguồn mở, để các nhà giao dịch có thể xem xét và xác minh chức năng. Chúc mừng tác giả! Mặc dù bạn có thể sử dụng miễn phí, hãy nhớ rằng việc công bố lại mã phải tuân theo Nội quy.
Thông báo miễn trừ trách nhiệm
Thông tin và các ấn phẩm này không nhằm mục đích, và không cấu thành, lời khuyên hoặc khuyến nghị về tài chính, đầu tư, giao dịch hay các loại khác do TradingView cung cấp hoặc xác nhận. Đọc thêm tại Điều khoản Sử dụng.