OPEN-SOURCE SCRIPT
Cập nhật Horizontal Price Table
Overview:
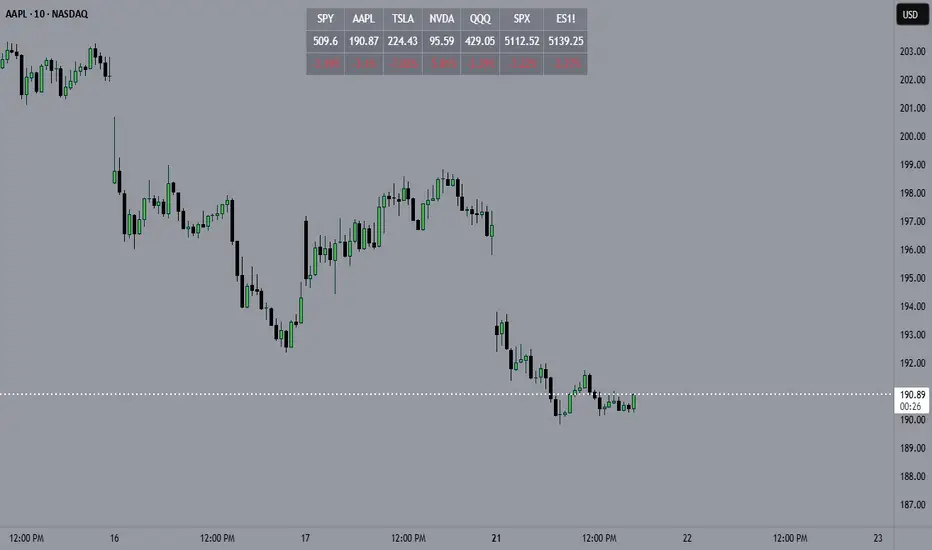
This script displays a dynamic price table on your chart, showing real-time prices and daily percentage changes for up to 7 user-defined tickers. You can customize both which tickers are shown and how many are visible, all through the settings panel.
How it works (Step-by-Step):
User-Defined Tickers:
The script provides input fields for up to 7 tickers using input.symbol(). You can track stocks, indexes, ETFs, crypto, or futures — anything supported by TradingView.
Choose How Many to Display:
An additional dropdown lets you choose how many of the 7 tickers to actually display (between 1 and 7). This gives you control over screen space and focus.
Market Data Fetching:
For each displayed ticker, the script fetches:
The current day’s closing price (close)
The previous day’s closing price (close[1])
This data is pulled using request.security() on the daily timeframe (1D).
% Change Calculation:
The script calculates the daily percentage change using:
(Current Price−Previous Close)/Previous Close×100(Current Price−Previous Close)/Previous Close×100
Cleaned Ticker Names:
Ticker symbols often include an exchange prefix like NASDAQ:AAPL. The script automatically removes anything before the colon (:), so only the clean symbol (e.g., AAPL) is shown in the table.
Table Display:
A visual table appears at the top-center of your chart, showing:
Customization:
Why Use This Script?
Tips:
This script displays a dynamic price table on your chart, showing real-time prices and daily percentage changes for up to 7 user-defined tickers. You can customize both which tickers are shown and how many are visible, all through the settings panel.
How it works (Step-by-Step):
User-Defined Tickers:
The script provides input fields for up to 7 tickers using input.symbol(). You can track stocks, indexes, ETFs, crypto, or futures — anything supported by TradingView.
Choose How Many to Display:
An additional dropdown lets you choose how many of the 7 tickers to actually display (between 1 and 7). This gives you control over screen space and focus.
Market Data Fetching:
For each displayed ticker, the script fetches:
The current day’s closing price (close)
The previous day’s closing price (close[1])
This data is pulled using request.security() on the daily timeframe (1D).
% Change Calculation:
The script calculates the daily percentage change using:
(Current Price−Previous Close)/Previous Close×100(Current Price−Previous Close)/Previous Close×100
Cleaned Ticker Names:
Ticker symbols often include an exchange prefix like NASDAQ:AAPL. The script automatically removes anything before the colon (:), so only the clean symbol (e.g., AAPL) is shown in the table.
Table Display:
A visual table appears at the top-center of your chart, showing:
- Row 1: Ticker symbol (cleaned)
- Row 2: Current price (rounded to 2 decimals)
- Row 3: Daily % change (green for gains, red for losses)
Customization:
- You can choose the background color of the table.
- Ticker names appear in white text with a gray background.
- % change is color-coded: green for positive, red for negative.
Why Use This Script?
- Track multiple tickers at once without leaving your chart.
- Clean, customizable layout.
- Useful for monitoring watchlists, portfolios, or related markets.
Tips:
- Combine this with your favorite indicators for a personalized dashboard.
- Works great on any chart or timeframe.
- Ensure the tickers entered are valid on TradingView (e.g., SPY, BTCUSD, NQ1!, etc.).
Phát hành các Ghi chú
Overview:This script displays a dynamic price table on your chart, showing real-time prices and daily percentage changes for up to 7 user-defined tickers. You can customize both which tickers are shown and how many are visible, all through the settings panel.
How it works (Step-by-Step):
User-Defined Tickers:
The script provides input fields for up to 7 tickers using input.symbol(). You can track stocks, indexes, ETFs, crypto, or futures — anything supported by TradingView.
Choose How Many to Display:
An additional dropdown lets you choose how many of the 7 tickers to actually display (between 1 and 7). This gives you control over screen space and focus.
Market Data Fetching:
For each displayed ticker, the script fetches:
The current day’s closing price (close)
The previous day’s closing price (close[1])
This data is pulled using request.security() on the daily timeframe (1D).
% Change Calculation:
The script calculates the daily percentage change using:
(Current Price−Previous Close)/Previous Close×100(Current Price−Previous Close)/Previous Close×100
Cleaned Ticker Names:
Ticker symbols often include an exchange prefix like NASDAQ:AAPL. The script automatically removes anything before the colon (:), so only the clean symbol (e.g., AAPL) is shown in the table.
Table Display:
A visual table appears at the top-center of your chart, showing:
- Row 1: Ticker symbol (cleaned)
- Row 2: Current price (rounded to 2 decimals)
- Row 3: Daily % change (green for gains, red for losses)
Customization:
- You can choose the background color of the table.
- Ticker names appear in white text with a gray background.
% change is color-coded: green for positive, red for negative.
Why Use This Script?
- Track multiple tickers at once without leaving your chart.
- Clean, customizable layout.
- Useful for monitoring watchlists, portfolios, or related markets.
Tips:
- Combine this with your favorite indicators for a personalized dashboard.
- Works great on any chart or timeframe.
- Ensure the tickers entered are valid on TradingView (e.g., SPY, BTCUSD, NQ1!, etc.).
Mã nguồn mở
Theo đúng tinh thần TradingView, tác giả của tập lệnh này đã công bố nó dưới dạng mã nguồn mở, để các nhà giao dịch có thể xem xét và xác minh chức năng. Chúc mừng tác giả! Mặc dù bạn có thể sử dụng miễn phí, hãy nhớ rằng việc công bố lại mã phải tuân theo Nội quy.
Thông báo miễn trừ trách nhiệm
Thông tin và các ấn phẩm này không nhằm mục đích, và không cấu thành, lời khuyên hoặc khuyến nghị về tài chính, đầu tư, giao dịch hay các loại khác do TradingView cung cấp hoặc xác nhận. Đọc thêm tại Điều khoản Sử dụng.