FibPivot FluidTrades Pro
Trading Plan
⏰ Timeframe
Best suited for 15-minute for direction and signal or 5/1-minute for Ep chart intraday.
For swing trades, consider 4H or 1H.
✅ Trade Setup Conditions
1. Market Structure Confirmation (MS, BOS, MSS)
Use BOS (Break of Structure) or MSS (Market Structure Shift) labels:
✅ Bullish Bias: Look for MSS/BOS up (price breaks previous swing high).
✅ Bearish Bias: Look for MSS/BOS down (price breaks previous swing low).
2. Supply & Demand Zones
Look for:
Demand box = long bias.
Supply box = short bias.
Avoid entering inside zones—wait for a retest/rejection or BOS out of zone.
3. Entry Signal
Buy Entry:
Green "Buy" shape appears. 50% of Candle
Price is above ATR trailing stop.
Signal appears near a demand zone, above MA200, and preferably above pivot level.
Sell Entry:
Red "Sell" shape appears. 50% of Candle
Price is below ATR trailing stop.
Signal appears near a supply zone, below MA200, and preferably below pivot level.
🧭 Confluences for Entry
Use 3+ of the following:
ATR trailing signal ✅
BOS/MSS ✅
Demand/Supply zone (fresh) ✅
Price above/below MA200 ✅
Close above/below pivot or Fib levels ✅
Candle breaks 50% of signal candle ✅
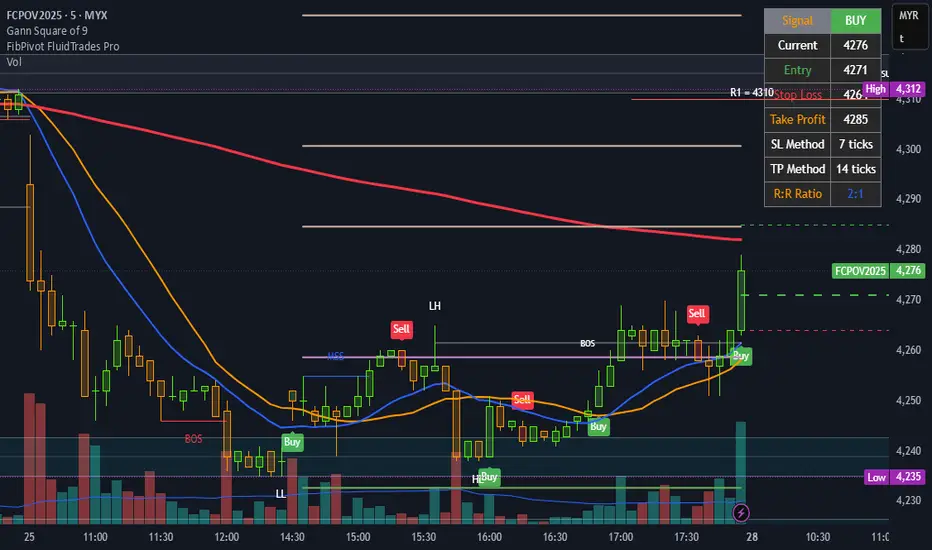
🎯 Entry, Stop Loss, Take Profit
Component Setting
Entry Midpoint of signal candle (auto drawn line)
Stop Loss Fixed 7 ticks (adjustable via settings)
Take Profit Fixed 14 ticks (default R:R = 2:1)
Trail Option ATR trailing stop (optional exit)
📉 Exit Strategy
Exit fully at TP line.
Or:
Partial at 1:1 (7 ticks).
Remainder at 2:1 (14 ticks).
Or trail with x ATRTrailingStop.
🚫 Avoid Trades When:
Price is inside supply/demand zones (indecision).
No BOS/MSS or weak structure.
Trading against MA200 slope/direction.
Entering near strong Fib pivot levels acting as support/resistance.
🔔 Alerts Available
Buy Signal (UT Long)
Sell Signal (UT Short)
BOS/MSS alerts (bull/bear)
🛠️ Risk Management
Risk only 1–2% of your capital per trade.
Follow the table display for low risk
Entry and Stop loss
TP
Risk-Reward Ratio (R:R)
Stick to predefined ticks for consistency.
📝 Example Trade Flow (Long):
MSS label (Bull) appears.
A Demand zone is drawn and respected.
Buy Signal appears above ATR trailing stop.
Price is above MA200.
Entry at midpoint of signal candle.
SL = -7 ticks, TP = +14 ticks.
P/S "I just wanted to say a big thank you to masterpiece FluidTrades SMC Lite script, clean, smart, and very useful. It helped me spot better entries and structure my trades properly.
Tập lệnh chỉ hiển thị cho người được mời
Chỉ những người dùng được tác giả chấp thuận mới có thể truy cập tập lệnh này. Bạn sẽ cần yêu cầu và được cấp quyền sử dụng. Thông thường quyền này được cấp sau khi thanh toán. Để biết thêm chi tiết, làm theo hướng dẫn của tác giả bên dưới hoặc liên hệ trực tiếp với amzoy068.
TradingView KHÔNG khuyến nghị bạn trả phí hoặc sử dụng một tập lệnh trừ khi bạn hoàn toàn tin tưởng vào tác giả và hiểu cách hoạt động của tập lệnh. Bạn cũng có thể tìm các lựa chọn miễn phí, mã nguồn mở trong các script cộng đồng của chúng tôi.
Hướng dẫn của tác giả
Thông báo miễn trừ trách nhiệm
Tập lệnh chỉ hiển thị cho người được mời
Chỉ những người dùng được tác giả chấp thuận mới có thể truy cập tập lệnh này. Bạn sẽ cần yêu cầu và được cấp quyền sử dụng. Thông thường quyền này được cấp sau khi thanh toán. Để biết thêm chi tiết, làm theo hướng dẫn của tác giả bên dưới hoặc liên hệ trực tiếp với amzoy068.
TradingView KHÔNG khuyến nghị bạn trả phí hoặc sử dụng một tập lệnh trừ khi bạn hoàn toàn tin tưởng vào tác giả và hiểu cách hoạt động của tập lệnh. Bạn cũng có thể tìm các lựa chọn miễn phí, mã nguồn mở trong các script cộng đồng của chúng tôi.