OPEN-SOURCE SCRIPT
Cập nhật Pivot Points
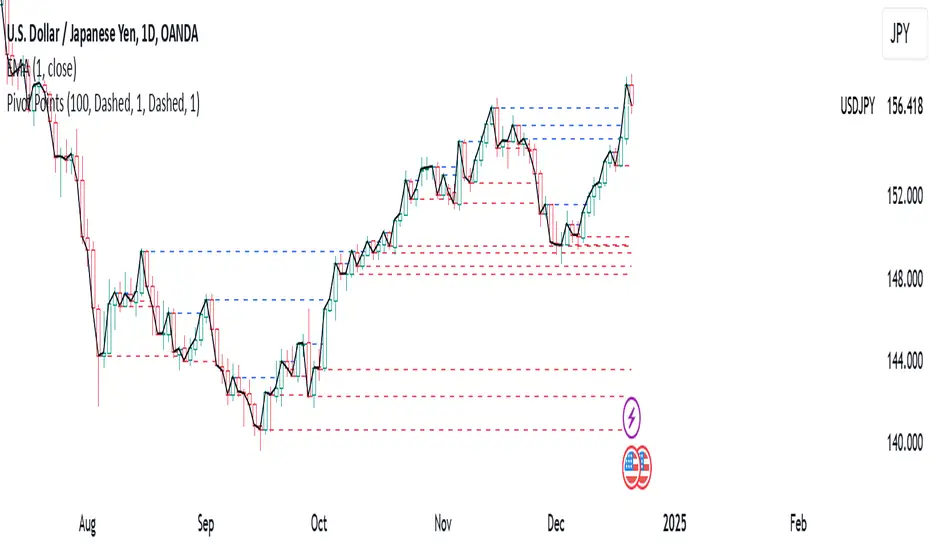
Pivot Points Indicator
The Pivot Points indicator highlights areas on the chart where candles close in opposite colors. These points occur when the price shifts from bullish to bearish, or vice versa, indicating potential reversals or continuation patterns. These points are more easily seen on a line chart and represent areas where the price changes direction to create peak formations.
Foundational Concepts
Before diving into the indicator, it’s important to understand a few key concepts:
When price is trending upward, it creates higher highs and higher lows. Each high or low acts as a pivot point. In an uptrend, the price is more likely to break the previous high (pivot point) and continue higher. You can enter a buy trade when the price breaks the previous high, anticipating the continuation of the trend.
When price is trending downward, it creates lower lows and lower highs. Each high or low is also a pivot point. In a downtrend, the price is more likely to break the previous low (pivot point) and continue lower. You can enter a sell trade when the price breaks the previous low, anticipating the continuation of the trend.
For reversal trades, it’s helpful to be familiar with chart patterns like double tops, double bottoms, and head and shoulders. The Pivot Points indicator can assist in identifying these patterns, helping you determine entry points, as well as where to place your stop loss.
Recommended Setup
It’s recommended to have two charts open side by side: one displaying a line chart and the other showing a candlestick chart, with the Pivot Points indicator applied to both. This setup allows you to easily identify the market structure and price action as it approaches these levels. You can also add a 20-period Simple Moving Average (SMA) to both charts to help identify the overall trend. Additionally, consider adding the Relative Strength Index (RSI) to the line chart to confirm overbought or oversold conditions.
This approach can be used on any timeframe.
Contributing
If you have suggestions, improvements, or bug fixes, I encourage you to submit pull requests. Collaboration helps make the indicator more versatile and useful for everyone.
Disclaimer
Any trading decisions you make are entirely your responsibility.
The MetaTrader 5 version of this indicator is available on my GitHub repository: roshaneforde/pivot-points-indicator
Phát hành các Ghi chú
Pivot Points IndicatorThe Pivot Points indicator highlights areas on the chart where candles close in opposite colors. These points occur when the price shifts from bullish to bearish, or vice versa, indicating potential reversals or continuation patterns. These points are more easily seen on a line chart and represent areas where the price changes direction to create peak formations.
Foundational Concepts
Before diving into the indicator, it’s important to understand a few key concepts:
When price is trending upward, it creates higher highs and higher lows. Each high or low acts as a pivot point. In an uptrend, the price is more likely to break the previous high (pivot point) and continue higher. You can enter a buy trade when the price breaks the previous high, anticipating the continuation of the trend.
When price is trending downward, it creates lower lows and lower highs. Each high or low is also a pivot point. In a downtrend, the price is more likely to break the previous low (pivot point) and continue lower. You can enter a sell trade when the price breaks the previous low, anticipating the continuation of the trend.
For reversal trades, it’s helpful to be familiar with chart patterns like double tops, double bottoms, and head and shoulders. The Pivot Points indicator can assist in identifying these patterns, helping you determine entry points, as well as where to place your stop loss.
Recommended Setup
It’s recommended to have two charts open side by side: one displaying a line chart and the other showing a candlestick chart, with the Pivot Points indicator applied to both. This setup allows you to easily identify the market structure and price action as it approaches these levels. You can also add a 20-period Simple Moving Average (SMA) to both charts to help identify the overall trend. Additionally, consider adding the Relative Strength Index (RSI) to the line chart to confirm overbought or oversold conditions.
This approach can be used on any timeframe.
Contributing
If you have suggestions, improvements, or bug fixes, I encourage you to submit pull requests. Collaboration helps make the indicator more versatile and useful for everyone.
Disclaimer
Any trading decisions you make are entirely your responsibility.
The MetaTrader 5 version of this indicator is available on my GitHub repository: roshaneforde/pivot-points-indicator
Phát hành các Ghi chú
Revert to the previous versionPhát hành các Ghi chú
Update the number of candles to draw onMã nguồn mở
Theo đúng tinh thần TradingView, tác giả của tập lệnh này đã công bố nó dưới dạng mã nguồn mở, để các nhà giao dịch có thể xem xét và xác minh chức năng. Chúc mừng tác giả! Mặc dù bạn có thể sử dụng miễn phí, hãy nhớ rằng việc công bố lại mã phải tuân theo Nội quy.
Thông báo miễn trừ trách nhiệm
Thông tin và các ấn phẩm này không nhằm mục đích, và không cấu thành, lời khuyên hoặc khuyến nghị về tài chính, đầu tư, giao dịch hay các loại khác do TradingView cung cấp hoặc xác nhận. Đọc thêm tại Điều khoản Sử dụng.
Mã nguồn mở
Theo đúng tinh thần TradingView, tác giả của tập lệnh này đã công bố nó dưới dạng mã nguồn mở, để các nhà giao dịch có thể xem xét và xác minh chức năng. Chúc mừng tác giả! Mặc dù bạn có thể sử dụng miễn phí, hãy nhớ rằng việc công bố lại mã phải tuân theo Nội quy.
Thông báo miễn trừ trách nhiệm
Thông tin và các ấn phẩm này không nhằm mục đích, và không cấu thành, lời khuyên hoặc khuyến nghị về tài chính, đầu tư, giao dịch hay các loại khác do TradingView cung cấp hoặc xác nhận. Đọc thêm tại Điều khoản Sử dụng.