RSI Overbought, Oversold and over/under midline
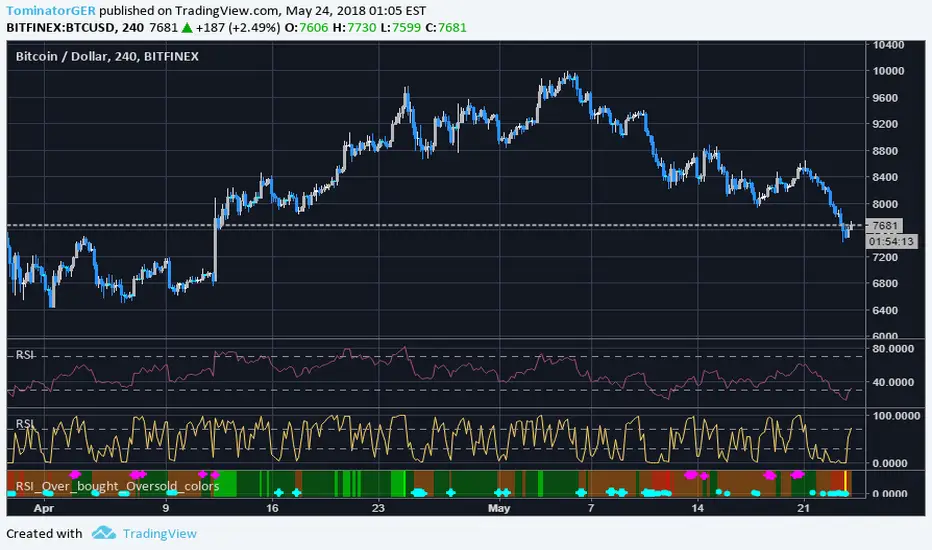
- Circles = RSI 2 period is in overbought /-sold -> Weaker buy / sell signal
- Cross = RSI 2 period is in overbought /-sold + price is above MA200 + below MA5 -> stronger buy / sell entry signal
- brown / dark green background = RSI 14 over or under midline -> Indicates bullish / bearisch momentum
- light red / green background = RSI 14 over 70 or under 30 -> Normal RSI overbought /-sold state
- red / bright green background = RSI 14 over 80 or under 20 -> Stronger RSI overbought /-sold state
- yellow background = RSI 14 over / under the 52 week high / low -> Very strong RSI overbought /-sold state
The indicator is designed to work on multiple chart layouts and smaller screens where you would not see the exact RSI states in the normal RSI indicator. You can also identify the RSI state very quick and it saves you space because you can identify the states even if the indicator window is very small.
Please give feedback in the comments what you think and what you would do better.
For access please leave a comment.
Tập lệnh chỉ hiển thị cho người được mời
Chỉ những người dùng được tác giả chấp thuận mới có thể truy cập tập lệnh này. Bạn sẽ cần yêu cầu và được cấp quyền sử dụng. Thông thường quyền này được cấp sau khi thanh toán. Để biết thêm chi tiết, làm theo hướng dẫn của tác giả bên dưới hoặc liên hệ trực tiếp với TominatorGER.
TradingView KHÔNG khuyến nghị bạn trả phí hoặc sử dụng một tập lệnh trừ khi bạn hoàn toàn tin tưởng vào tác giả và hiểu cách hoạt động của tập lệnh. Bạn cũng có thể tìm các lựa chọn miễn phí, mã nguồn mở trong các script cộng đồng của chúng tôi.
Hướng dẫn của tác giả
Thông báo miễn trừ trách nhiệm
Tập lệnh chỉ hiển thị cho người được mời
Chỉ những người dùng được tác giả chấp thuận mới có thể truy cập tập lệnh này. Bạn sẽ cần yêu cầu và được cấp quyền sử dụng. Thông thường quyền này được cấp sau khi thanh toán. Để biết thêm chi tiết, làm theo hướng dẫn của tác giả bên dưới hoặc liên hệ trực tiếp với TominatorGER.
TradingView KHÔNG khuyến nghị bạn trả phí hoặc sử dụng một tập lệnh trừ khi bạn hoàn toàn tin tưởng vào tác giả và hiểu cách hoạt động của tập lệnh. Bạn cũng có thể tìm các lựa chọn miễn phí, mã nguồn mở trong các script cộng đồng của chúng tôi.