OPEN-SOURCE SCRIPT
Ultimate Gold Correlation Matrix (Extended)
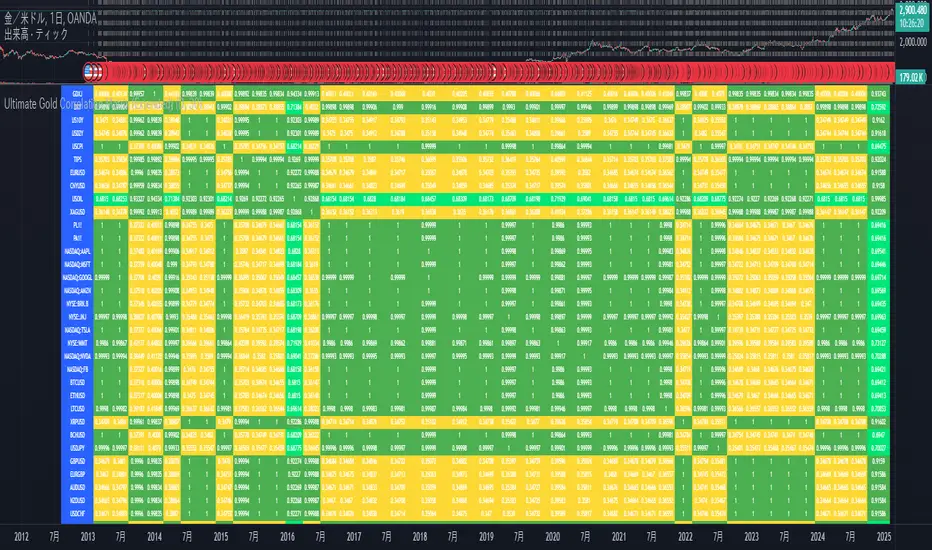
This is a correlation matrix to help you visually understand the relationship between stocks. This is the correlation of the amount of change.
The color changes depending on the value of the correlation value.
By making a node diagram of this relationship, what has been difficult to understand may become clearer.
Good luck.
1. meaning of correlation coefficient
Correlation Coefficient ranges from -1 to +1.
Correlation Coefficient Value Interpretation
+1.00 Perfect positive correlation (when one goes up, the other always goes up)
+0.75 ~ +0.99 Strong positive correlation (fairly well linked)
+0.50 ~ +0.74 Moderate positive correlation
+0.30 ~ +0.49 Weak positive correlation
-0.30 ~ +0.30 No correlation (no or weak relationship)
-0.50 ~ -0.74 Moderate negative correlation
-0.75 ~ -0.99 Strong negative correlation (when one goes up, the other goes down)
-1.00 Perfect negative correlation (opposite moves)
Translated with DeepL.com/Translator (free version)
Mã nguồn mở
Theo đúng tinh thần TradingView, tác giả của tập lệnh này đã công bố nó dưới dạng mã nguồn mở, để các nhà giao dịch có thể xem xét và xác minh chức năng. Chúc mừng tác giả! Mặc dù bạn có thể sử dụng miễn phí, hãy nhớ rằng việc công bố lại mã phải tuân theo Nội quy.
Thông báo miễn trừ trách nhiệm
Thông tin và các ấn phẩm này không nhằm mục đích, và không cấu thành, lời khuyên hoặc khuyến nghị về tài chính, đầu tư, giao dịch hay các loại khác do TradingView cung cấp hoặc xác nhận. Đọc thêm tại Điều khoản Sử dụng.