OPEN-SOURCE SCRIPT
Cập nhật Horizontal Lines from Current Price
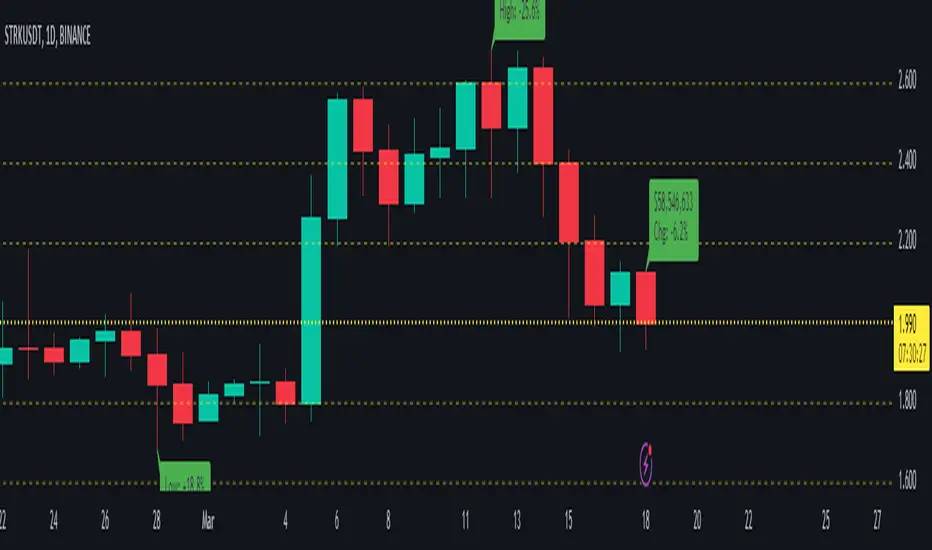
This indicator will help traders track price fluctuations in smaller time frames more conveniently than ever before.
Here's how it works:
Additionally, we also provide volume display (measured in USD) at the current candle position to assist traders in keeping track of market momentum more closely.
Installation guide for indicators:
Here's how it works:
Starting from the current price, the indicator will draw horizontal lines spaced 10% apart.
Now, whenever zooming in or out of the chart, traders can visually determine the level of price volatility more easily.
Additionally, we also provide volume display (measured in USD) at the current candle position to assist traders in keeping track of market momentum more closely.
Installation guide for indicators:
After installing the indicator, make sure that the indicator is merged with the price chart.
Secondly, ensure that the scale bar of the indicator merges with the scale bar of the price chart.
Phát hành các Ghi chú
Update default inputsPhát hành các Ghi chú
Clean source code & InputsPhát hành các Ghi chú
➕ Added the feature to view the highest and lowest price changes of the current bar compared to the previous bars.⚡⚡⚡Phát hành các Ghi chú
Clean source code 🚧🚧🚧Phát hành các Ghi chú
➕ Added the feature to view the changes in the current price bar.⚡⚡⚡Phát hành các Ghi chú
Clean source code 🚧🚧🚧Phát hành các Ghi chú
Update display current price 🚧🚧🚧Phát hành các Ghi chú
Fix bug 🚧🚧🚧Phát hành các Ghi chú
Fix bug 🚧🚧🚧Phát hành các Ghi chú
Fix bug 🚧🚧🚧Phát hành các Ghi chú
Fix bug 🚧🚧🚧Phát hành các Ghi chú
Fix bug 🚧🚧🚧Phát hành các Ghi chú
Fix bug 🚧🚧🚧Phát hành các Ghi chú
Fix bug 🚧🚧🚧Mã nguồn mở
Theo đúng tinh thần TradingView, tác giả của tập lệnh này đã công bố nó dưới dạng mã nguồn mở, để các nhà giao dịch có thể xem xét và xác minh chức năng. Chúc mừng tác giả! Mặc dù bạn có thể sử dụng miễn phí, hãy nhớ rằng việc công bố lại mã phải tuân theo Nội quy.
Thông báo miễn trừ trách nhiệm
Thông tin và các ấn phẩm này không nhằm mục đích, và không cấu thành, lời khuyên hoặc khuyến nghị về tài chính, đầu tư, giao dịch hay các loại khác do TradingView cung cấp hoặc xác nhận. Đọc thêm tại Điều khoản Sử dụng.
Mã nguồn mở
Theo đúng tinh thần TradingView, tác giả của tập lệnh này đã công bố nó dưới dạng mã nguồn mở, để các nhà giao dịch có thể xem xét và xác minh chức năng. Chúc mừng tác giả! Mặc dù bạn có thể sử dụng miễn phí, hãy nhớ rằng việc công bố lại mã phải tuân theo Nội quy.
Thông báo miễn trừ trách nhiệm
Thông tin và các ấn phẩm này không nhằm mục đích, và không cấu thành, lời khuyên hoặc khuyến nghị về tài chính, đầu tư, giao dịch hay các loại khác do TradingView cung cấp hoặc xác nhận. Đọc thêm tại Điều khoản Sử dụng.