OPEN-SOURCE SCRIPT
Simple Monthly Seasonality
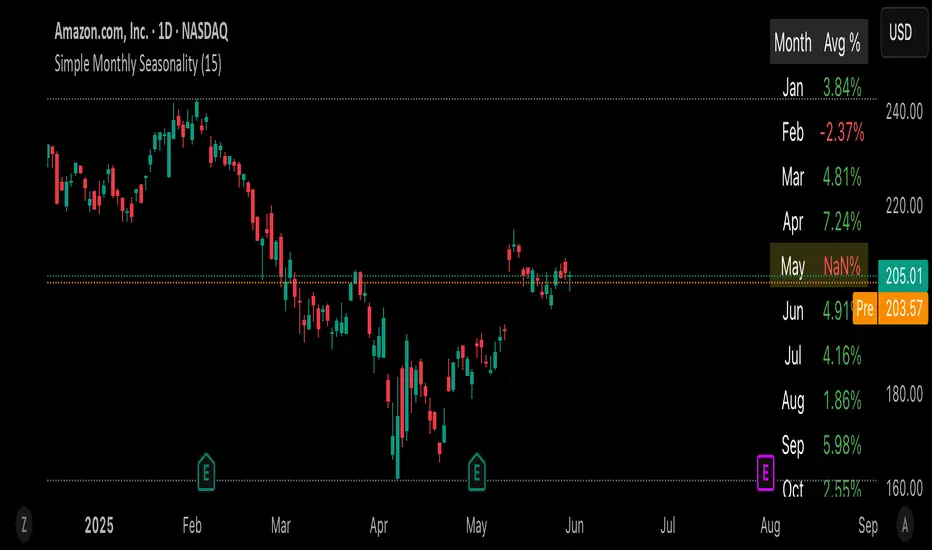
This script helps traders quickly visualize how an asset performs month by month over a customizable historical period.
🔍 What it does:
• Calculates average monthly returns over the past N years (default: 15).
• Highlights the current month for quick context.
• Displays results in a clean 2-column table (Month | Avg % Return).
💡 Features:
• Works on any timeframe – internally pulls monthly data.
• Color-coded performance (green for positive, red for negative).
• Dynamic highlights – the current month is softly emphasized.
• Fully customizable lookback period (1–50 years).
📈 Use cases:
• Spot seasonal market trends.
• Time entries/exits based on recurring historical strength/weakness.
• Build the foundation for more advanced seasonality or macro scripts.
Just load it on any chart and see which months historically outshine the rest.
⸻
Mã nguồn mở
Theo đúng tinh thần TradingView, tác giả của tập lệnh này đã công bố nó dưới dạng mã nguồn mở, để các nhà giao dịch có thể xem xét và xác minh chức năng. Chúc mừng tác giả! Mặc dù bạn có thể sử dụng miễn phí, hãy nhớ rằng việc công bố lại mã phải tuân theo Nội quy.
Thông báo miễn trừ trách nhiệm
Thông tin và các ấn phẩm này không nhằm mục đích, và không cấu thành, lời khuyên hoặc khuyến nghị về tài chính, đầu tư, giao dịch hay các loại khác do TradingView cung cấp hoặc xác nhận. Đọc thêm tại Điều khoản Sử dụng.