OPEN-SOURCE SCRIPT
Cập nhật [SGM VaR Stats VS Empirical]
Main Functions
Logarithmic Returns & Historical Data
Calculates logarithmic returns from closing prices.
Stores these returns in a dynamic array with a configurable maximum size.
Approximation of the Inverse Error Function
Uses an approximation of the erfinv function to calculate z-scores for given confidence levels.
Basic Statistics
Mean: Calculates the average of the data in the array.
Standard Deviation: Measures the dispersion of returns.
Median: Provides a more robust measure of central tendency for skewed distributions.
Z-Score: Converts a confidence level into a standard deviation multiplier.
Empirical vs. Statistical Projection
Empirical Projection
Based on the median of cumulative returns for each projected period.
Applies an adjustable confidence filter to exclude extreme values.
Statistical Projection
Relies on the mean and standard deviation of historical returns.
Incorporates a standard deviation multiplier for confidence-adjusted projections.
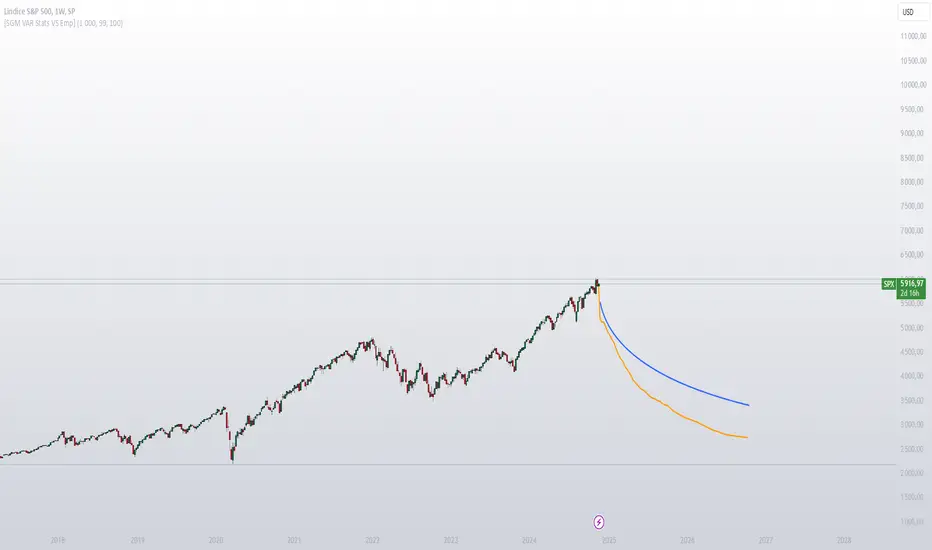
PolyLines (Graphs)
Generates projections visually through polylines:
Statistical Polyline (Blue): Based on traditional statistical methods.
Empirical Polyline (Orange): Derived from empirical data analysis.
Projection Customization
Maximum Data Size: Configurable limit for the historical data array (max_array_size).
Confidence Level: Adjustable by the user (conf_lvl), affects the width of the confidence bands.
Projection Length: Configurable number of projected periods (length_projection).
Key Steps
Capture logarithmic returns and update the historical data array.
Calculate basic statistics (mean, median, standard deviation).
Perform projections:
Empirical: Based on the median of cumulative returns.
Statistical: Based on the mean and standard deviation.
Visualization:
Compare statistical and empirical projections using polylines.
Utility
This script allows users to compare:
Traditional Statistical Projections: Based on mathematical properties of historical returns.
Empirical Projections: Relying on direct historical observations.
Divergence or convergence of these lines also highlights the presence of skewness or kurtosis in the return distribution.

Ideal for traders and financial analysts looking to assess an asset’s potential future performance using combined statistical and empirical approaches.
Logarithmic Returns & Historical Data
Calculates logarithmic returns from closing prices.
Stores these returns in a dynamic array with a configurable maximum size.
Approximation of the Inverse Error Function
Uses an approximation of the erfinv function to calculate z-scores for given confidence levels.
Basic Statistics
Mean: Calculates the average of the data in the array.
Standard Deviation: Measures the dispersion of returns.
Median: Provides a more robust measure of central tendency for skewed distributions.
Z-Score: Converts a confidence level into a standard deviation multiplier.
Empirical vs. Statistical Projection
Empirical Projection
Based on the median of cumulative returns for each projected period.
Applies an adjustable confidence filter to exclude extreme values.
Statistical Projection
Relies on the mean and standard deviation of historical returns.
Incorporates a standard deviation multiplier for confidence-adjusted projections.
PolyLines (Graphs)
Generates projections visually through polylines:
Statistical Polyline (Blue): Based on traditional statistical methods.
Empirical Polyline (Orange): Derived from empirical data analysis.
Projection Customization
Maximum Data Size: Configurable limit for the historical data array (max_array_size).
Confidence Level: Adjustable by the user (conf_lvl), affects the width of the confidence bands.
Projection Length: Configurable number of projected periods (length_projection).
Key Steps
Capture logarithmic returns and update the historical data array.
Calculate basic statistics (mean, median, standard deviation).
Perform projections:
Empirical: Based on the median of cumulative returns.
Statistical: Based on the mean and standard deviation.
Visualization:
Compare statistical and empirical projections using polylines.
Utility
This script allows users to compare:
Traditional Statistical Projections: Based on mathematical properties of historical returns.
Empirical Projections: Relying on direct historical observations.
Divergence or convergence of these lines also highlights the presence of skewness or kurtosis in the return distribution.
Ideal for traders and financial analysts looking to assess an asset’s potential future performance using combined statistical and empirical approaches.
Phát hành các Ghi chú
changing initial settingsPhát hành các Ghi chú
-Mã nguồn mở
Theo đúng tinh thần TradingView, tác giả của tập lệnh này đã công bố nó dưới dạng mã nguồn mở, để các nhà giao dịch có thể xem xét và xác minh chức năng. Chúc mừng tác giả! Mặc dù bạn có thể sử dụng miễn phí, hãy nhớ rằng việc công bố lại mã phải tuân theo Nội quy.
Sigaud | Junior Quantitative Trader & Developer
Combining technical expertise with analytical precision.
Gaining experience and growing in the field.
📧 Contact: from the website
Combining technical expertise with analytical precision.
Gaining experience and growing in the field.
📧 Contact: from the website
Thông báo miễn trừ trách nhiệm
Thông tin và các ấn phẩm này không nhằm mục đích, và không cấu thành, lời khuyên hoặc khuyến nghị về tài chính, đầu tư, giao dịch hay các loại khác do TradingView cung cấp hoặc xác nhận. Đọc thêm tại Điều khoản Sử dụng.
Mã nguồn mở
Theo đúng tinh thần TradingView, tác giả của tập lệnh này đã công bố nó dưới dạng mã nguồn mở, để các nhà giao dịch có thể xem xét và xác minh chức năng. Chúc mừng tác giả! Mặc dù bạn có thể sử dụng miễn phí, hãy nhớ rằng việc công bố lại mã phải tuân theo Nội quy.
Sigaud | Junior Quantitative Trader & Developer
Combining technical expertise with analytical precision.
Gaining experience and growing in the field.
📧 Contact: from the website
Combining technical expertise with analytical precision.
Gaining experience and growing in the field.
📧 Contact: from the website
Thông báo miễn trừ trách nhiệm
Thông tin và các ấn phẩm này không nhằm mục đích, và không cấu thành, lời khuyên hoặc khuyến nghị về tài chính, đầu tư, giao dịch hay các loại khác do TradingView cung cấp hoặc xác nhận. Đọc thêm tại Điều khoản Sử dụng.