OPEN-SOURCE SCRIPT
Cập nhật Average price in candle
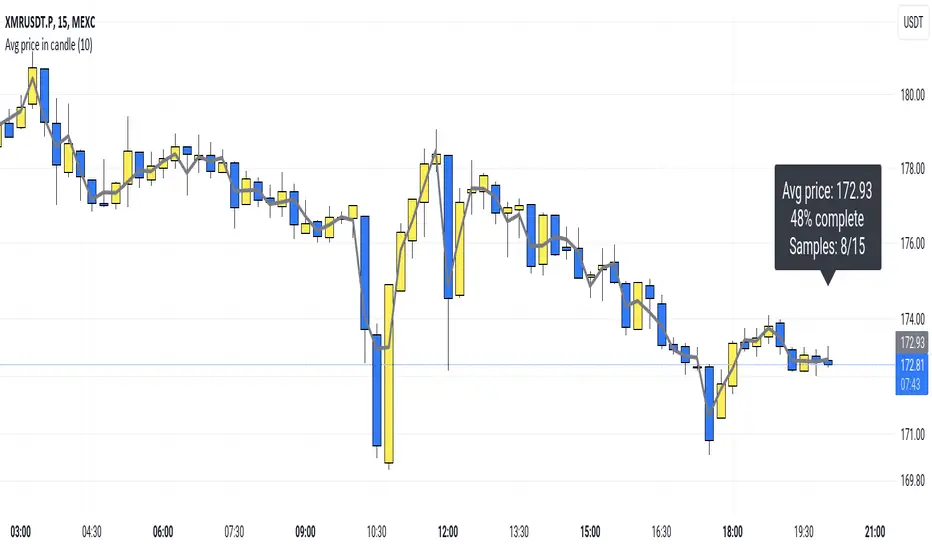
Plots the average price a security had within a candle.
So, for example: If you have a 15m candle, and price stayed near the candle's high for 10 out of the 15 minutes, you would expect the average price top be near the candle's high as well. And that's actually how it is.
(Blue 10:30 candle in the screenshot.)
I think this "average in-candle price" could be a useful thing to know. You can't gather this information from the normal chart (as you would need to go to a lower timeframe). Plus this plot can be smoother than plots of, say, closing price or hl2.
The calculation happens in a lower timeframe which is selected automatically. There is a precision selector which allows you to influence this. By default, at least 10 values are sampled for each candle.
If you have TradingView Premium, the script is able to use second-based intervals to look inside 1m candles. (Tick the corresponding checkbox to enable this.)
How it works: I collect timestamps and hl2 values from the lower timeframe. (I figure hl2 is the best choice here because a close is so arbitrary. If we don't have further information, our guess is the average is simply exactly in the middle of the candle's range.)
Then I throw the last close and current close (from the CHART timeframe) into the mix and calculate an average of the prices we collected weighted by the duration that price was in effect.
tl;dr; It's just math baby
Phát hành các Ghi chú
Made the line slightly transparent (nice if you put it in front of the candles)Mã nguồn mở
Theo đúng tinh thần TradingView, tác giả của tập lệnh này đã công bố nó dưới dạng mã nguồn mở, để các nhà giao dịch có thể xem xét và xác minh chức năng. Chúc mừng tác giả! Mặc dù bạn có thể sử dụng miễn phí, hãy nhớ rằng việc công bố lại mã phải tuân theo Nội quy.
Thông báo miễn trừ trách nhiệm
Thông tin và các ấn phẩm này không nhằm mục đích, và không cấu thành, lời khuyên hoặc khuyến nghị về tài chính, đầu tư, giao dịch hay các loại khác do TradingView cung cấp hoặc xác nhận. Đọc thêm tại Điều khoản Sử dụng.
Mã nguồn mở
Theo đúng tinh thần TradingView, tác giả của tập lệnh này đã công bố nó dưới dạng mã nguồn mở, để các nhà giao dịch có thể xem xét và xác minh chức năng. Chúc mừng tác giả! Mặc dù bạn có thể sử dụng miễn phí, hãy nhớ rằng việc công bố lại mã phải tuân theo Nội quy.
Thông báo miễn trừ trách nhiệm
Thông tin và các ấn phẩm này không nhằm mục đích, và không cấu thành, lời khuyên hoặc khuyến nghị về tài chính, đầu tư, giao dịch hay các loại khác do TradingView cung cấp hoặc xác nhận. Đọc thêm tại Điều khoản Sử dụng.