OPEN-SOURCE SCRIPT
Cập nhật Banana RSI
Banana RSI is not just ap-PEAL-ing to the eyes!
This simple little indicator provides a New Approach to determining Overbought and Oversold levels, as well as taking advantage of a non-typical smoothing method for this type of indicator.
Banana RSI uses a Cumulative High and Low Average to draw the upper, lower, and midline.
The High and Low Averages use the data only from above or below the Cumulative Average to calculate their respective line.
In simpler terms:
This creates an automated method to determine overbought and oversold territory based on the charts historical movement.
Since every chart can be different, these levels change with the chart.
Banana RSI also uses a linear regression smoothing method, by taking advantage of the built-in Least Squares Moving Average, we are able to view a better reacting/less-lagging moving average.
Included are 2 Length-Adjustable LSMA lines to use however needed.
Using the Regression Lines along with the High & Low Averages provides a new view on the classic RSI indicator.
Enjoy!
This simple little indicator provides a New Approach to determining Overbought and Oversold levels, as well as taking advantage of a non-typical smoothing method for this type of indicator.
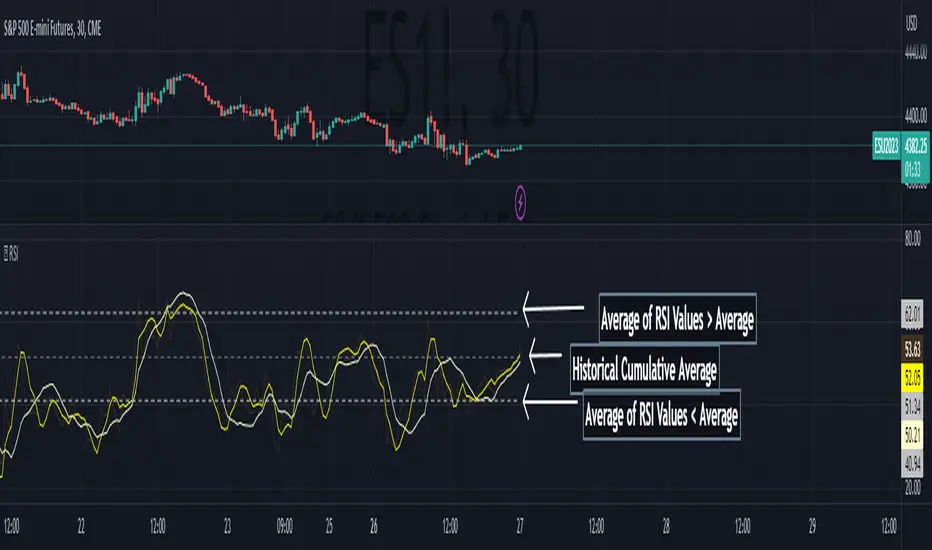
Banana RSI uses a Cumulative High and Low Average to draw the upper, lower, and midline.
The High and Low Averages use the data only from above or below the Cumulative Average to calculate their respective line.
In simpler terms:
- The High average is an average of every value ABOVE the full average.
- The Low average is an average of every value BELOW the full average.
This creates an automated method to determine overbought and oversold territory based on the charts historical movement.
Since every chart can be different, these levels change with the chart.
Banana RSI also uses a linear regression smoothing method, by taking advantage of the built-in Least Squares Moving Average, we are able to view a better reacting/less-lagging moving average.
Included are 2 Length-Adjustable LSMA lines to use however needed.
Using the Regression Lines along with the High & Low Averages provides a new view on the classic RSI indicator.
Enjoy!
Phát hành các Ghi chú
formatting errorMã nguồn mở
Theo đúng tinh thần TradingView, tác giả của tập lệnh này đã công bố nó dưới dạng mã nguồn mở, để các nhà giao dịch có thể xem xét và xác minh chức năng. Chúc mừng tác giả! Mặc dù bạn có thể sử dụng miễn phí, hãy nhớ rằng việc công bố lại mã phải tuân theo Nội quy.
Custom PineScript Development:
reciodev.com
Paid Indicators:
tradingview.com/spaces/SamRecio/
reciodev.com
Paid Indicators:
tradingview.com/spaces/SamRecio/
Thông báo miễn trừ trách nhiệm
Thông tin và các ấn phẩm này không nhằm mục đích, và không cấu thành, lời khuyên hoặc khuyến nghị về tài chính, đầu tư, giao dịch hay các loại khác do TradingView cung cấp hoặc xác nhận. Đọc thêm tại Điều khoản Sử dụng.
Mã nguồn mở
Theo đúng tinh thần TradingView, tác giả của tập lệnh này đã công bố nó dưới dạng mã nguồn mở, để các nhà giao dịch có thể xem xét và xác minh chức năng. Chúc mừng tác giả! Mặc dù bạn có thể sử dụng miễn phí, hãy nhớ rằng việc công bố lại mã phải tuân theo Nội quy.
Custom PineScript Development:
reciodev.com
Paid Indicators:
tradingview.com/spaces/SamRecio/
reciodev.com
Paid Indicators:
tradingview.com/spaces/SamRecio/
Thông báo miễn trừ trách nhiệm
Thông tin và các ấn phẩm này không nhằm mục đích, và không cấu thành, lời khuyên hoặc khuyến nghị về tài chính, đầu tư, giao dịch hay các loại khác do TradingView cung cấp hoặc xác nhận. Đọc thêm tại Điều khoản Sử dụng.