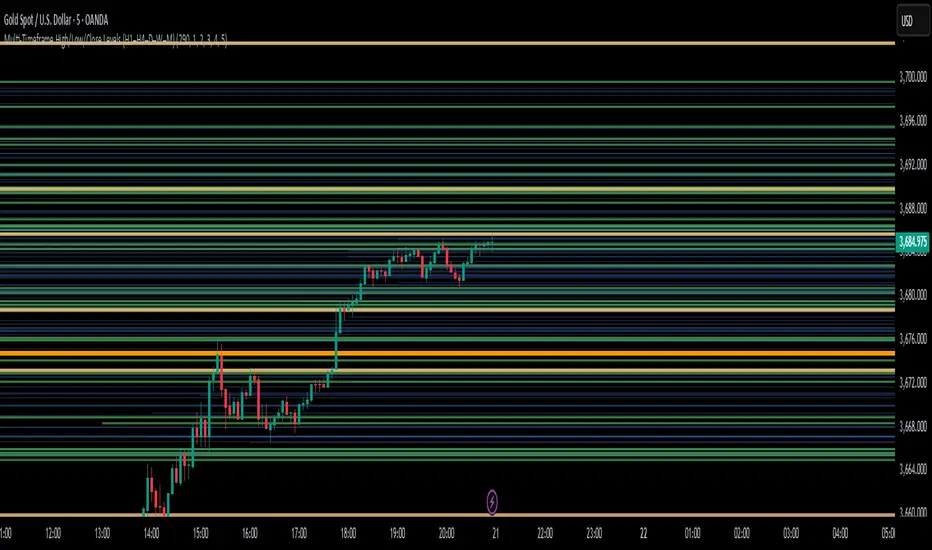
Multi-Timeframe High/Low/Close Levels (H1–H4–D–W–M)
H1 (1-Hour)
H4 (4-Hour)
Daily (1-Day)
Weekly (1-Week)
Monthly (1-Month)
Key Features:
Draws High, Low, and Close levels for each timeframe.
Each level starts from its own candle and extends to the right.
Levels are filtered to stay close to the current price, keeping the chart clean.
Automatic line management ensures that the total number of levels never exceeds the user-defined limit (default: 300, adjustable up to 400).
Customizable colors, widths, and visibility for each timeframe in the Style tab.
Usage:
Use these levels as dynamic support and resistance zones.
Higher-timeframe levels are drawn with stronger colors and thicker lines, giving visual priority over lower-timeframe levels.
Tập lệnh chỉ hiển thị cho người được mời
Chỉ những người dùng được tác giả chấp thuận mới có thể truy cập tập lệnh này. Bạn sẽ cần yêu cầu và được cấp quyền sử dụng. Thông thường quyền này được cấp sau khi thanh toán. Để biết thêm chi tiết, làm theo hướng dẫn của tác giả bên dưới hoặc liên hệ trực tiếp với Vahid_Sehat.
TradingView KHÔNG khuyến nghị bạn trả phí hoặc sử dụng một tập lệnh trừ khi bạn hoàn toàn tin tưởng vào tác giả và hiểu cách hoạt động của tập lệnh. Bạn cũng có thể tìm các lựa chọn miễn phí, mã nguồn mở trong các script cộng đồng của chúng tôi.
Hướng dẫn của tác giả
Thông báo miễn trừ trách nhiệm
Tập lệnh chỉ hiển thị cho người được mời
Chỉ những người dùng được tác giả chấp thuận mới có thể truy cập tập lệnh này. Bạn sẽ cần yêu cầu và được cấp quyền sử dụng. Thông thường quyền này được cấp sau khi thanh toán. Để biết thêm chi tiết, làm theo hướng dẫn của tác giả bên dưới hoặc liên hệ trực tiếp với Vahid_Sehat.
TradingView KHÔNG khuyến nghị bạn trả phí hoặc sử dụng một tập lệnh trừ khi bạn hoàn toàn tin tưởng vào tác giả và hiểu cách hoạt động của tập lệnh. Bạn cũng có thể tìm các lựa chọn miễn phí, mã nguồn mở trong các script cộng đồng của chúng tôi.