OPEN-SOURCE SCRIPT
Cập nhật EMA Multi Cross
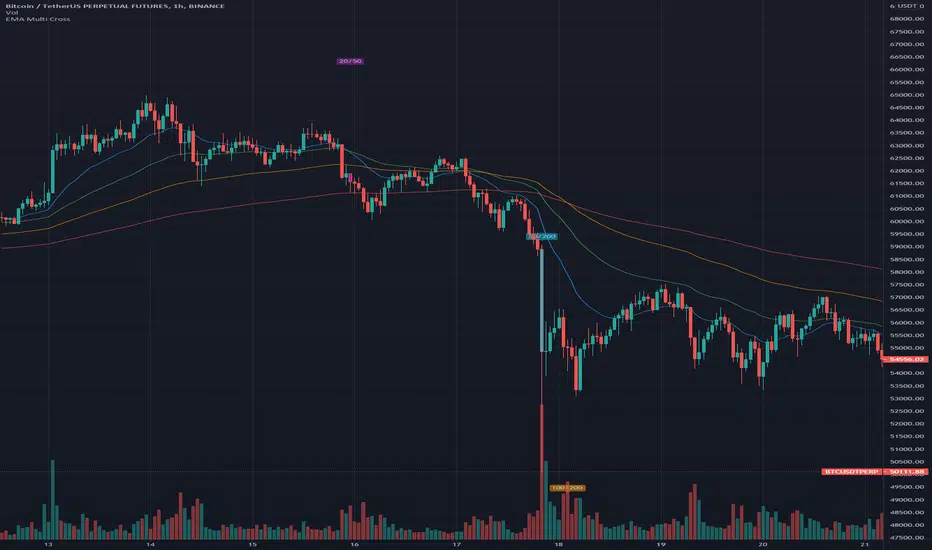
This is just a very simple EMA indicator that shows the 20, 50, 100, and 200 Exponential Moving Averages and plots some shapes when the lines cross from the 20 & 50, the 50 & 200, and the 100 & 200.
I know there are many EMA indicators out there, but I couldn't find one that let me edit the colors, values, and toggle the crossings. Maybe some of you will find usefulness in having some of these extra options too.
I use this occasionally on the Bitcoin 1 hour charts to see how the long-term trend is going.
Here are some ways to read EMA lines:
Slope: A rising moving average generally reflects a rising trend, while a falling moving average points to a falling trend.
Crosses: Seeing when a slower moving average crosses over/under a faster moving average can be an indication of a trend. If a shorter moving average remains above the longer moving average after they cross, the uptrend is considered intact. The trend is seen as down when the shorter moving average is below the longer moving average.
I prefer the slope of the two since crosses can cause some false positives if you are relying on it for trades.
Phát hành các Ghi chú
Added bar coloring as requested.20 crossing with 50 shows a purple candle.
50 crossing with 200 shows an aqua candle.
100 crossing with 200 shows an orange candle.
Mã nguồn mở
Theo đúng tinh thần TradingView, tác giả của tập lệnh này đã công bố nó dưới dạng mã nguồn mở, để các nhà giao dịch có thể xem xét và xác minh chức năng. Chúc mừng tác giả! Mặc dù bạn có thể sử dụng miễn phí, hãy nhớ rằng việc công bố lại mã phải tuân theo Nội quy.
Thông báo miễn trừ trách nhiệm
Thông tin và các ấn phẩm này không nhằm mục đích, và không cấu thành, lời khuyên hoặc khuyến nghị về tài chính, đầu tư, giao dịch hay các loại khác do TradingView cung cấp hoặc xác nhận. Đọc thêm tại Điều khoản Sử dụng.