OPEN-SOURCE SCRIPT
NASDAQ Trading System with Pivots
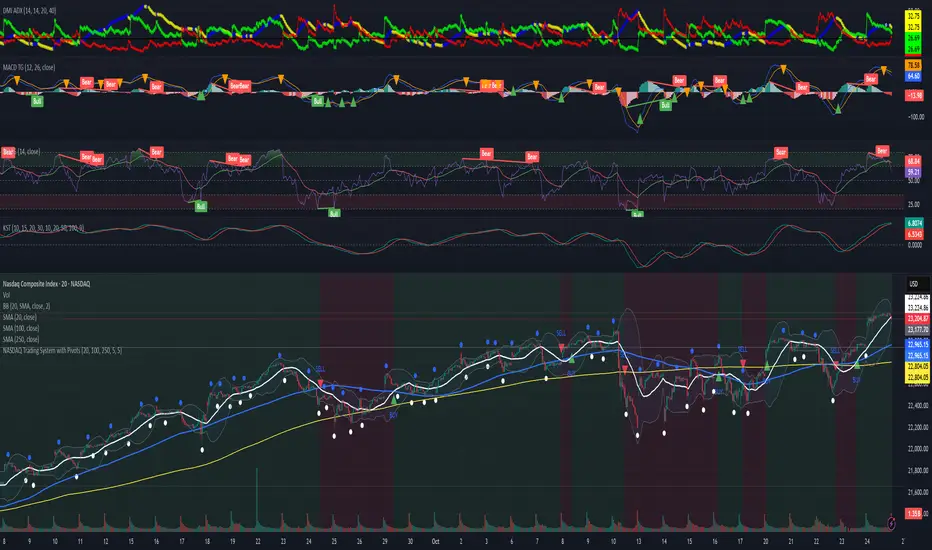
This TradingView indicator, designed for the 30-minute NASDAQ (^IXIC) chart, guides QQQ options trading using a trend-following strategy. It plots a 20-period SMA (blue) and a 100-period SMA (red), with an optional 250-period SMA (orange) inspired by rauItrades' NASDAQ SMA outfit. A bullish crossover (20 SMA > 100 SMA) triggers a green "BUY" triangle below the bar, signaling a potential long position in QQQ, while a bearish crossunder (20 SMA < 100 SMA) shows a red "SELL" triangle above, indicating a short or exit. The background colors green (bullish) or red (bearish) for trend bias. Orange circles (recent highs) and purple circles (recent lows) mark support/resistance levels using 5-bar pivot points.
Mã nguồn mở
Theo đúng tinh thần TradingView, tác giả của tập lệnh này đã công bố nó dưới dạng mã nguồn mở, để các nhà giao dịch có thể xem xét và xác minh chức năng. Chúc mừng tác giả! Mặc dù bạn có thể sử dụng miễn phí, hãy nhớ rằng việc công bố lại mã phải tuân theo Nội quy.
Thông báo miễn trừ trách nhiệm
Thông tin và các ấn phẩm này không nhằm mục đích, và không cấu thành, lời khuyên hoặc khuyến nghị về tài chính, đầu tư, giao dịch hay các loại khác do TradingView cung cấp hoặc xác nhận. Đọc thêm tại Điều khoản Sử dụng.