OPEN-SOURCE SCRIPT
Cập nhật Panoramic EMA - Multi Timeframe
Panoramic EMA - Multi Timeframe
This indicator provides a straightforward visualization of Exponential Moving Averages (EMAs) from multiple timeframes simultaneously. This indicator allows traders to customize the display of EMAs, making it easier to identify and analyze trends and potential support or resistance levels across different periods.
Settings:
EMA Lengths: Customize up to five EMA lengths. Activating a length will display its EMA line on the chart for the selected timeframes.
Timeframes Selection: Choose up to four different timeframes to display the EMAs. This lets you observe how EMAs behave on various scales from a single chart.
Interpretation:
Utilize the EMAs as potential zones of dynamic support or resistance.
Observe the relationship between price action and EMAs across different timeframes to gauge market sentiment and identify trend consistency or potential shifts.
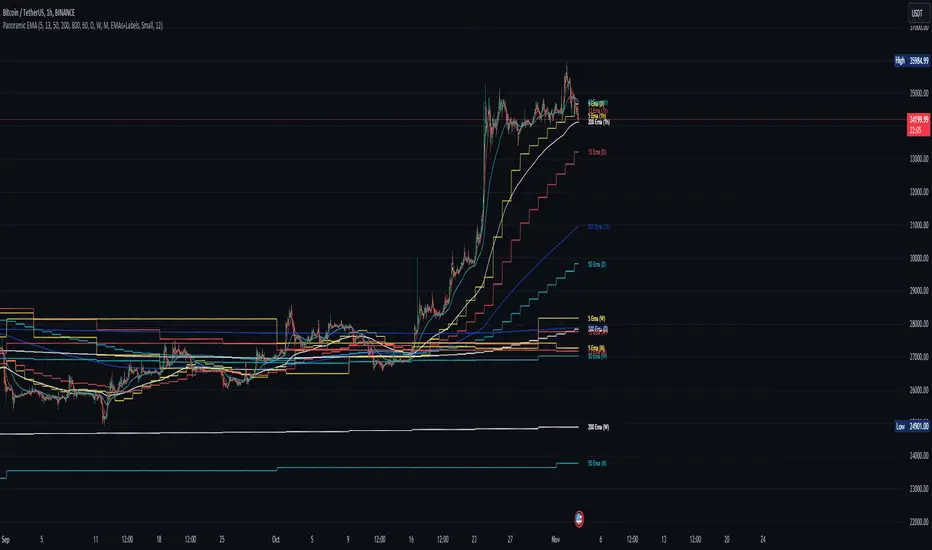
This tool is designed to offer visual clues about the market state through the behavior of EMAs. It does not generate direct buy or sell signals. It is recommended to understand how the assets you are trading interact with EMAs. For instance, in our example below, Bitcoin demonstrates a tendency to interact with the 800 and 200-length EMAs on the 4-hour timeframe, providing areas where price rejections may occur:

Note: This is a utility-focused indicator meant to supplement your market analysis and should be used in conjunction with other analysis methods or indicators for the best results.
This indicator provides a straightforward visualization of Exponential Moving Averages (EMAs) from multiple timeframes simultaneously. This indicator allows traders to customize the display of EMAs, making it easier to identify and analyze trends and potential support or resistance levels across different periods.
Settings:
EMA Lengths: Customize up to five EMA lengths. Activating a length will display its EMA line on the chart for the selected timeframes.
Timeframes Selection: Choose up to four different timeframes to display the EMAs. This lets you observe how EMAs behave on various scales from a single chart.
Interpretation:
Utilize the EMAs as potential zones of dynamic support or resistance.
Observe the relationship between price action and EMAs across different timeframes to gauge market sentiment and identify trend consistency or potential shifts.
This tool is designed to offer visual clues about the market state through the behavior of EMAs. It does not generate direct buy or sell signals. It is recommended to understand how the assets you are trading interact with EMAs. For instance, in our example below, Bitcoin demonstrates a tendency to interact with the 800 and 200-length EMAs on the 4-hour timeframe, providing areas where price rejections may occur:
Note: This is a utility-focused indicator meant to supplement your market analysis and should be used in conjunction with other analysis methods or indicators for the best results.
Phát hành các Ghi chú
- Added support for different MA types
Phát hành các Ghi chú
- Fill empty parenthesis on current timeframe with 'CTF'
Mã nguồn mở
Theo đúng tinh thần TradingView, tác giả của tập lệnh này đã công bố nó dưới dạng mã nguồn mở, để các nhà giao dịch có thể xem xét và xác minh chức năng. Chúc mừng tác giả! Mặc dù bạn có thể sử dụng miễn phí, hãy nhớ rằng việc công bố lại mã phải tuân theo Nội quy.
Get access to our indicators at: huntergatherers.tech
Thông báo miễn trừ trách nhiệm
Thông tin và các ấn phẩm này không nhằm mục đích, và không cấu thành, lời khuyên hoặc khuyến nghị về tài chính, đầu tư, giao dịch hay các loại khác do TradingView cung cấp hoặc xác nhận. Đọc thêm tại Điều khoản Sử dụng.