OPEN-SOURCE SCRIPT
BLITZ JUNK BOND INDICATOR
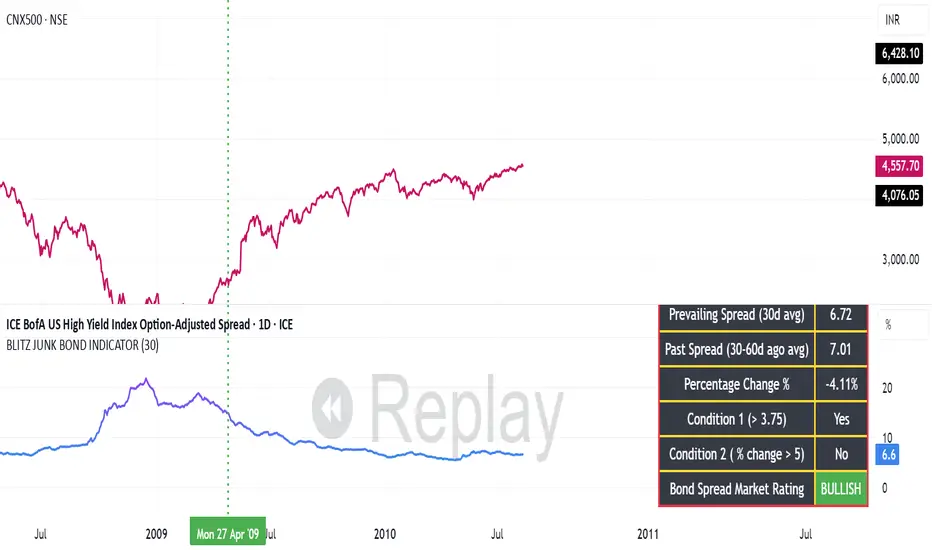
The given indicator considers the fluctuations in the bond market and the spread that are existing as a premium demanded by investors for high risk corporate junk bonds.
1. The junk bond spread indicator precisely anticipates market phases, especially any panic kind of scenario.
2. Junk bond spread indicator often face choppy market zone and entirely we must rely on our portfolio churning skills if such scenario occurs and the broader markets failed to perform even if the indicator has made us to make a buy position
3. Whenever Bullish signal comes, same is to be confirmed with the price action of the broader market index, then same to be confirmed in the junk bond spreads chart if the spreads are going down steadily or is breaking down from the nearest swing low and cooling off. This, scenario indicates we must expose our portfolio to equities
4. Whenever Bearish signal comes, same to be cofirmed with the price action of the broader market index, then same to be confirmed in the junk bond spread charts if the spreads are heating up breaking nearby swing highs or steadily moving up. In such scenario, we must prepare for heavy market drawdowns or must anticipate some panic scenario in the markets and thus should avoid equities.
Mã nguồn mở
Theo đúng tinh thần TradingView, tác giả của tập lệnh này đã công bố nó dưới dạng mã nguồn mở, để các nhà giao dịch có thể xem xét và xác minh chức năng. Chúc mừng tác giả! Mặc dù bạn có thể sử dụng miễn phí, hãy nhớ rằng việc công bố lại mã phải tuân theo Nội quy.
Thông báo miễn trừ trách nhiệm
Thông tin và các ấn phẩm này không nhằm mục đích, và không cấu thành, lời khuyên hoặc khuyến nghị về tài chính, đầu tư, giao dịch hay các loại khác do TradingView cung cấp hoặc xác nhận. Đọc thêm tại Điều khoản Sử dụng.