OPEN-SOURCE SCRIPT
Cập nhật Nifty_Price_Movement_BuildUP
Dashboard to see Price Momentum Build-Up at Nifty.
It cumulates all prices and their respective weightage.
During initial of a candle, we are not aware of volume is High or Not, we only get it in later buildup. But Price buildup will display it at the same instant that what is going with the price of all stocks.
The logic used here is that
1) If a stock close > open at a particular instant it will add that stock multiplied with its weightage in Nifty to the list of stocks that are positive.
2) If a stock close < open at a particular instant it will add that stock multiplied with its weightage in Nifty to the list of stocks that are negative.
3) Above two will give you data that how many of them are positive and are negative at a particular instant and how they are going to affect Nifty.
In one of the many possible ways, it is superior than that of Volume buildup is that, to determine volume is higher than previous volume, we have to wait for first few seconds/minutes/hours (depending on timeframe you are in) to see volume buildup. The Volume buildup function based indicator is kind of lagging, though volume itself being instant.
Phát hành các Ghi chú
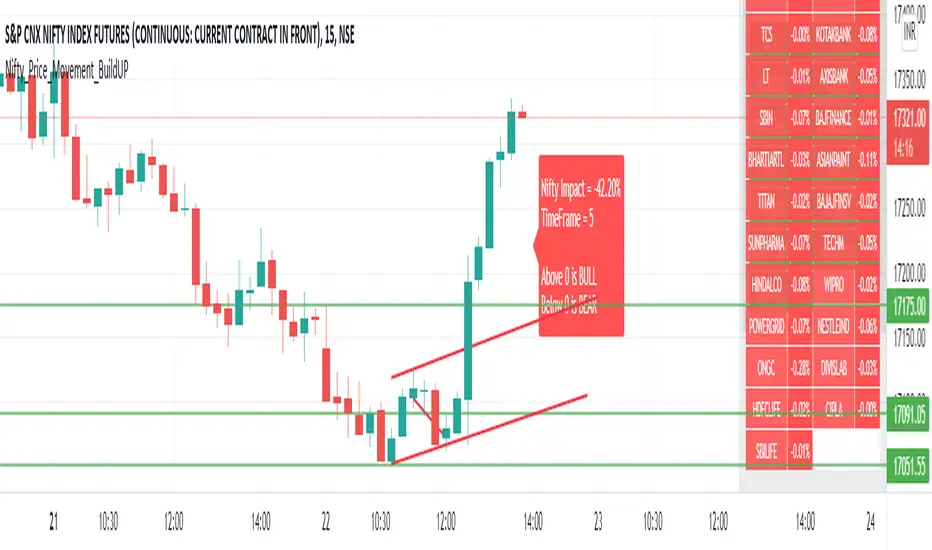
Dashboard to view Price Momentum Build-Up of nifty Top 40 stocks at Nifty .What is Price Moment Build-UP
Build-UP displays the percentage of Nifty Stocks is pushing Nifty index moving up or down.
Why it was developed?
During initial of a candle, we are not aware of volume is High or Not, we only get it in later buildup. But Price buildup will display it at the same instant that what is going with the price of all stocks. It cumulates all prices and their respective weightage.
Why it is better than Volume?
In one of the many possible ways, it is superior than that of Volume buildup is that, to determine volume is higher than previous volume , we have to wait for first few seconds/minutes/hours (depending on timeframe you are in) to see volume buildup. The Volume buildup function based indicator is kind of lagging, though volume itself being instant.
The logic used here is that:
1) If a stock close > open at a particular instant it will add that stock multiplied with its weightage in Nifty to the list of stocks that are positive.
2) If a stock close < open at a particular instant it will add that stock multiplied with its weightage in Nifty to the list of stocks that are negative.
3) Above two will give you data that how many of them are positive and are negative at a particular instant and how they are going to affect Nifty .
Updated:
1) Added a table format.
2) Added user defined table Transparency.
3) Added capability to view price change build-up at different time frame other than chart time frame.
4) Added facility to change table position at your will.
5) Added facility to add the date on which one changes weightage.
Issues:
Cannot add all 50 stocks due to the limitation of pine script to 40 stocks. But all these 40 stocks account to 96% weightage of Nifty.
Mã nguồn mở
Theo đúng tinh thần TradingView, tác giả của tập lệnh này đã công bố nó dưới dạng mã nguồn mở, để các nhà giao dịch có thể xem xét và xác minh chức năng. Chúc mừng tác giả! Mặc dù bạn có thể sử dụng miễn phí, hãy nhớ rằng việc công bố lại mã phải tuân theo Nội quy.
Thông báo miễn trừ trách nhiệm
Thông tin và các ấn phẩm này không nhằm mục đích, và không cấu thành, lời khuyên hoặc khuyến nghị về tài chính, đầu tư, giao dịch hay các loại khác do TradingView cung cấp hoặc xác nhận. Đọc thêm tại Điều khoản Sử dụng.