OPEN-SOURCE SCRIPT
Average Range Convergence Divergence
Hi there,
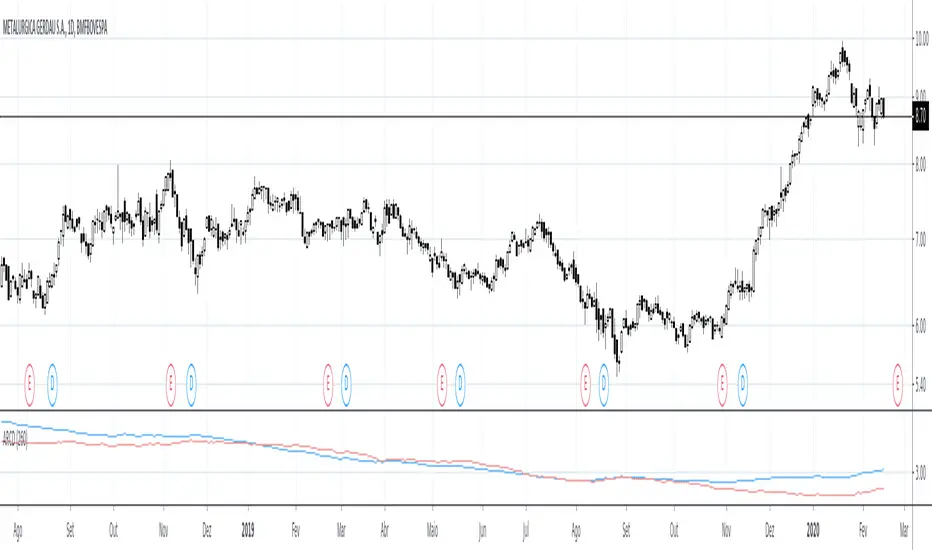
It's a script that plot the ATR (Average True Range) and ADR (Average Day Range) together and do an histogram of it. The histogram is the difference from ATR to ADR, I believe that it shows the average GAP in the asset. So I can easily found the offset to use when defining my stop.
PT
Esse script desenha o ATR (no profit True Range) e o ADR (media da diferença entre máximas e minimas) junto da diferença entre essas médias em formato de histograma. O gap médio de um ativo é mostrado no histograma.
Mã nguồn mở
Theo đúng tinh thần TradingView, tác giả của tập lệnh này đã công bố nó dưới dạng mã nguồn mở, để các nhà giao dịch có thể xem xét và xác minh chức năng. Chúc mừng tác giả! Mặc dù bạn có thể sử dụng miễn phí, hãy nhớ rằng việc công bố lại mã phải tuân theo Nội quy.
Thông báo miễn trừ trách nhiệm
Thông tin và các ấn phẩm này không nhằm mục đích, và không cấu thành, lời khuyên hoặc khuyến nghị về tài chính, đầu tư, giao dịch hay các loại khác do TradingView cung cấp hoặc xác nhận. Đọc thêm tại Điều khoản Sử dụng.