OPEN-SOURCE SCRIPT
VWAP angle
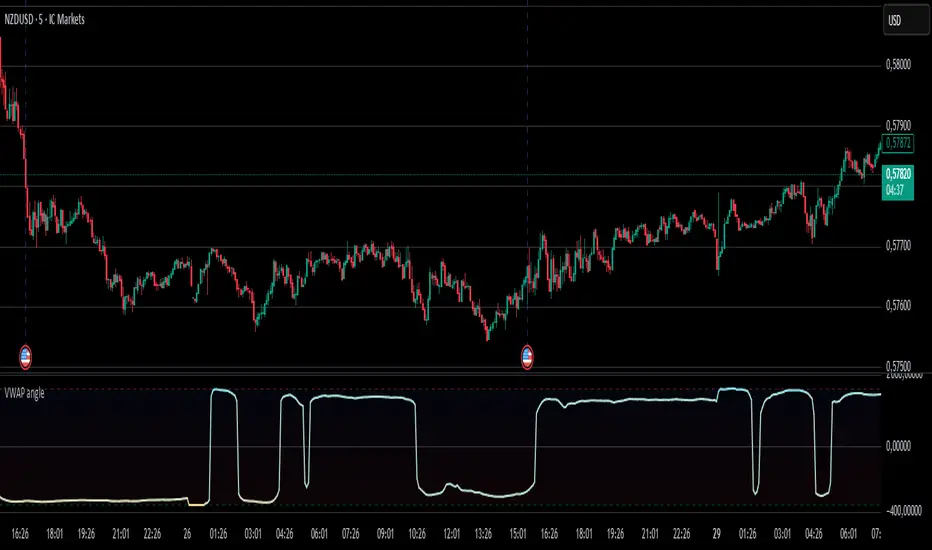
VWAP Angle Indicator
The VWAP Angle indicator is a technical analysis tool designed to measure the directional momentum of the Volume Weighted Average Price (VWAP). Rather than simply plotting the VWAP line itself, this indicator calculates the angle of the VWAP's trajectory over a specified lookback period. It converts the slope into degrees using arctangent mathematics, normalized by the Average True Range (ATR) to account for price volatility. The result is a momentum oscillator that ranges from -100 to +100, providing traders with a clear visual representation of whether the VWAP is trending sharply upward, downward, or moving sideways.
The indicator features customizable overbought and oversold zones (defaulting to +65 and -65 respectively) with color-coded bands to help identify potential reversal points or extreme market conditions. A dynamic color gradient transitions from cyan (bullish angles) to orange (bearish angles), making it easy to spot trend changes at a glance. The visualization includes multiple threshold bands at ±65 and ±80 levels, with shaded regions that intensify as the angle reaches extreme values, helping traders identify when momentum may be overextended.
Built-in alert functionality notifies traders when the VWAP angle crosses into overbought or oversold territories, with optional visual labels appearing directly on the indicator panel. This makes it particularly useful for automated trading strategies or for traders who want real-time notifications of potential trend exhaustion or reversal setups. The indicator works best when combined with other technical tools to confirm signals and filter out false alerts during choppy or ranging market conditions.
Mã nguồn mở
Theo đúng tinh thần TradingView, người tạo ra tập lệnh này đã biến tập lệnh thành mã nguồn mở để các nhà giao dịch có thể xem xét và xác minh công năng. Xin dành lời khen tặng cho tác giả! Mặc dù bạn có thể sử dụng miễn phí, nhưng lưu ý nếu đăng lại mã, bạn phải tuân theo Quy tắc nội bộ của chúng tôi.
Thông báo miễn trừ trách nhiệm
Thông tin và ấn phẩm không có nghĩa là và không cấu thành, tài chính, đầu tư, kinh doanh, hoặc các loại lời khuyên hoặc khuyến nghị khác được cung cấp hoặc xác nhận bởi TradingView. Đọc thêm trong Điều khoản sử dụng.