OPEN-SOURCE SCRIPT
Cập nhật Futures Correlation Visualizer

OVERVIEW
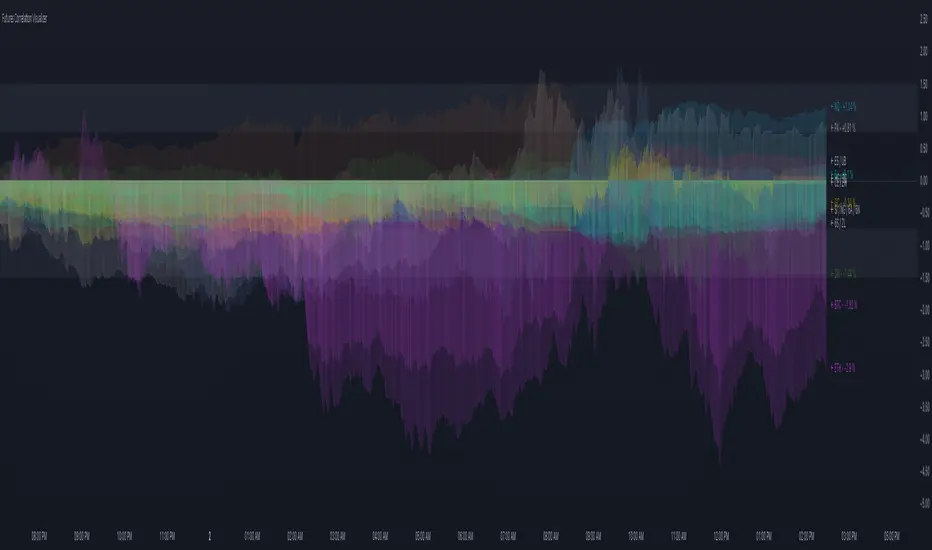
This indicator plots the normalized price changes of commonly traded futures. Visualizing data in this way makes studying and understanding market participation and sentiment easier.
Note:
Only 20 symbols can be plotted. The "request" functions are limited to 40 calls, 1 timeframe counts as a call, and 2 timeframes are used per symbol. Normalized values are derived by dividing the charts timeframe by 1D data. A runtime error will occur when more than 20 symbols are enabled. This limitation is unavoidable.
INPUTS
You can configure:
- Colors and color scheme
- Symbols to plot (most common futures)
- Norm. source (todays open / yesterdays close)
- Measurement type (%, ‱, Δ)
- Label, zone, and zero options
Phát hành các Ghi chú
- Added link to indicator page the top of the code.
- Updated chart
Phát hành các Ghi chú
- Minor code changes.
- Added "Smooth" option for color transitions.
- Converted to Pine Script v6
Phát hành các Ghi chú
- Updated script to align with Pine Script changes: Pine Script recently updated when loop boundaries were checked. Previously, the boundary was established before iterating. Now, the boundary is evaluated on each iteration.
Phát hành các Ghi chú
- Improved logic to be more reliable after partial trading days.
Mã nguồn mở
Theo đúng tinh thần TradingView, tác giả của tập lệnh này đã công bố nó dưới dạng mã nguồn mở, để các nhà giao dịch có thể xem xét và xác minh chức năng. Chúc mừng tác giả! Mặc dù bạn có thể sử dụng miễn phí, hãy nhớ rằng việc công bố lại mã phải tuân theo Nội quy.
Discord: discord.gg/bPAPhwUeud
Website: liquid-trader.com
Website: liquid-trader.com
Thông báo miễn trừ trách nhiệm
Thông tin và các ấn phẩm này không nhằm mục đích, và không cấu thành, lời khuyên hoặc khuyến nghị về tài chính, đầu tư, giao dịch hay các loại khác do TradingView cung cấp hoặc xác nhận. Đọc thêm tại Điều khoản Sử dụng.