OPEN-SOURCE SCRIPT
Chart CAGR
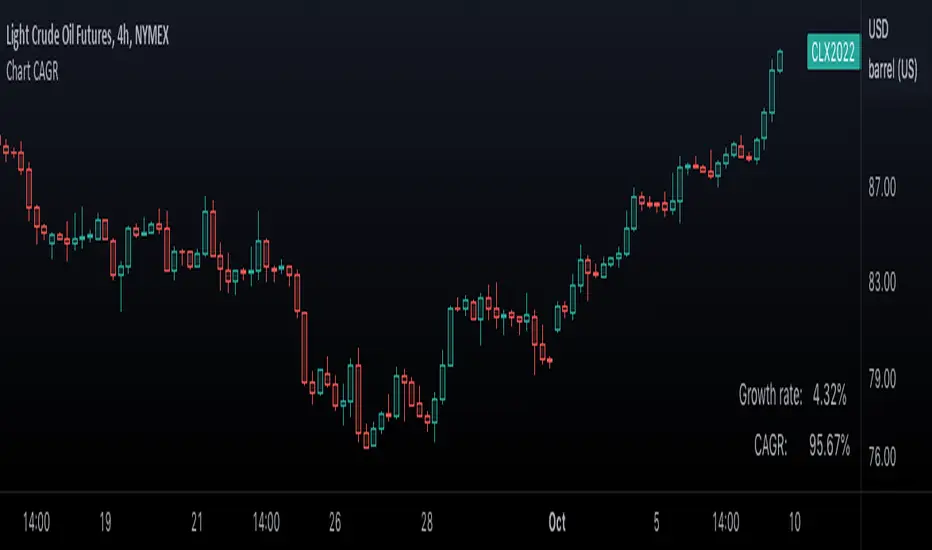
█ OVERVIEW
This simple script displays in the lower-right corner of the chart the Growth Rate and the Compound Annual Growth Rate (CAGR) between the open of the chart's first visible bar and the close of its last bar. As you zoom/scroll the chart, calculations will adjust to the chart's bars. You can change the location and colors of the displayed text in the script's settings.
If you need to calculate the CAGR between any two points on the chart, see our CAGR Custom Range indicator.
█ FOR Pine Script™ CODERS
Like our Chart VWAP publication, this script calculates on the range of visible bars utilizing the new Pine Script™ functions announced here and the VisibleChart library by PineCoders. It also uses the `cagr()` function from our ta library, which was recently augmented with many new functions.
Look first. Then leap.
Mã nguồn mở
Theo đúng tinh thần TradingView, tác giả của tập lệnh này đã công bố nó dưới dạng mã nguồn mở, để các nhà giao dịch có thể xem xét và xác minh chức năng. Chúc mừng tác giả! Mặc dù bạn có thể sử dụng miễn phí, hãy nhớ rằng việc công bố lại mã phải tuân theo Nội quy.
Share TradingView with a friend:
tradingview.com/share-your-love/
Check out all #tradingviewtips
tradingview.com/ideas/tradingviewtips/?type=education
New Tools and Features:
tradingview.com/blog/en/
tradingview.com/share-your-love/
Check out all #tradingviewtips
tradingview.com/ideas/tradingviewtips/?type=education
New Tools and Features:
tradingview.com/blog/en/
Thông báo miễn trừ trách nhiệm
Thông tin và các ấn phẩm này không nhằm mục đích, và không cấu thành, lời khuyên hoặc khuyến nghị về tài chính, đầu tư, giao dịch hay các loại khác do TradingView cung cấp hoặc xác nhận. Đọc thêm tại Điều khoản Sử dụng.