OPEN-SOURCE SCRIPT
AI SuperTrend Clustering Oscillator [LuxAlgo]
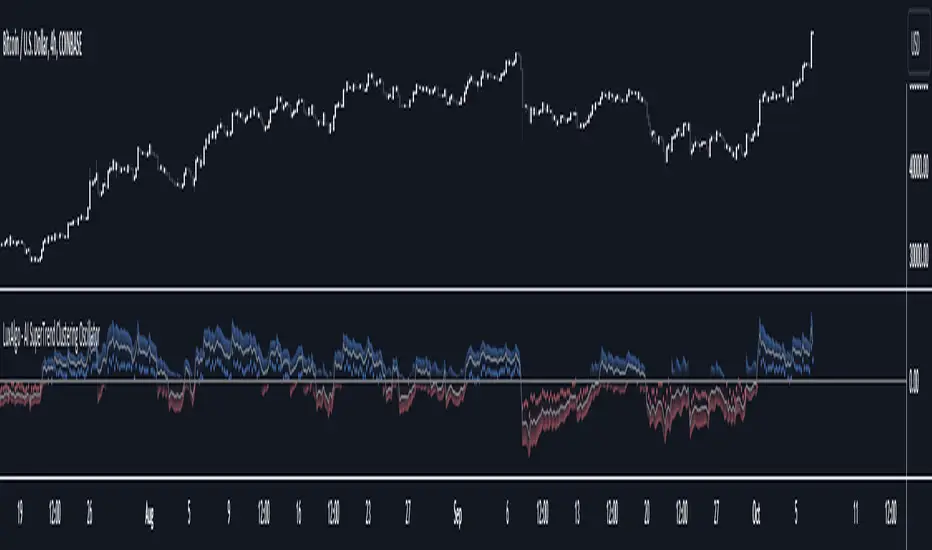
The AI SuperTrend Clustering Oscillator is an oscillator returning the most bullish/average/bearish centroids given by multiple instances of the difference between SuperTrend indicators.
This script is an extension of our previously posted SuperTrend AI indicator that makes use of k-means clustering. If you want to learn more about it see:
![SuperTrend AI (Clustering) [LuxAlgo]](https://s3.tradingview.com/w/wP7WWjLL_mid.png)
🔶 USAGE

The AI SuperTrend Clustering Oscillator is made of 3 distinct components, a bullish output (always the highest), a bearish output (always the lowest), and a "consensus" output always within the two others.
The general trend is given by the consensus output, with a value above 0 indicating an uptrend and under 0 indicating a downtrend. Using a higher minimum factor will weigh results toward longer-term trends, while lowering the maximum factor will weigh results toward shorter-term trends.

Strong trends are indicated when the bullish/bearish outputs are indicating an opposite sentiment. A strong bullish trend would for example be indicated when the bearish output is above 0, while a strong bearish trend would be indicated when the bullish output is below 0.

When the consensus output is indicating a specific trend direction, an opposite indication from the bullish/bearish output can highlight a potential reversal or retracement.
🔶 DETAILS
The indicator construction is based on finding three clusters from the difference between the closing price and various SuperTrend using different factors. The centroid of each cluster is then returned. This operation is done over all historical bars.
The highest cluster will be composed of the differences between the price and SuperTrends that are the highest, thus creating a more bullish group. The lowest cluster will be composed of the differences between the price and SuperTrends that are the lowest, thus creating a more bearish group.
The consensus cluster is composed of the differences between the price and SuperTrends that are not significant enough to be part of the other clusters.
🔶 SETTINGS
🔹 Optimization
This group of settings affects the runtime performances of the script.
This script is an extension of our previously posted SuperTrend AI indicator that makes use of k-means clustering. If you want to learn more about it see:
🔶 USAGE
The AI SuperTrend Clustering Oscillator is made of 3 distinct components, a bullish output (always the highest), a bearish output (always the lowest), and a "consensus" output always within the two others.
The general trend is given by the consensus output, with a value above 0 indicating an uptrend and under 0 indicating a downtrend. Using a higher minimum factor will weigh results toward longer-term trends, while lowering the maximum factor will weigh results toward shorter-term trends.
Strong trends are indicated when the bullish/bearish outputs are indicating an opposite sentiment. A strong bullish trend would for example be indicated when the bearish output is above 0, while a strong bearish trend would be indicated when the bullish output is below 0.
When the consensus output is indicating a specific trend direction, an opposite indication from the bullish/bearish output can highlight a potential reversal or retracement.
🔶 DETAILS
The indicator construction is based on finding three clusters from the difference between the closing price and various SuperTrend using different factors. The centroid of each cluster is then returned. This operation is done over all historical bars.
The highest cluster will be composed of the differences between the price and SuperTrends that are the highest, thus creating a more bullish group. The lowest cluster will be composed of the differences between the price and SuperTrends that are the lowest, thus creating a more bearish group.
The consensus cluster is composed of the differences between the price and SuperTrends that are not significant enough to be part of the other clusters.
🔶 SETTINGS
- ATR Length: ATR period used for the calculation of the SuperTrends.
- Factor Range: Determine the minimum and maximum factor values for the calculation of the SuperTrends.
- Step: Increments of the factor range.
- Smooth: Degree of smoothness of each output from the indicator.
🔹 Optimization
This group of settings affects the runtime performances of the script.
- Maximum Iteration Steps: Maximum number of iterations allowed for finding centroids. Excessively low values can return a better script load time but poor clustering.
- Historical Bars Calculation: Calculation window of the script (in bars).
Mã nguồn mở
Theo đúng tinh thần TradingView, tác giả của tập lệnh này đã công bố nó dưới dạng mã nguồn mở, để các nhà giao dịch có thể xem xét và xác minh chức năng. Chúc mừng tác giả! Mặc dù bạn có thể sử dụng miễn phí, hãy nhớ rằng việc công bố lại mã phải tuân theo Nội quy.
Get exclusive indicators & AI trading strategies: luxalgo.com
Free 150k+ community: discord.gg/lux
All content provided by LuxAlgo is for informational & educational purposes only. Past performance does not guarantee future results.
Free 150k+ community: discord.gg/lux
All content provided by LuxAlgo is for informational & educational purposes only. Past performance does not guarantee future results.
Thông báo miễn trừ trách nhiệm
Thông tin và các ấn phẩm này không nhằm mục đích, và không cấu thành, lời khuyên hoặc khuyến nghị về tài chính, đầu tư, giao dịch hay các loại khác do TradingView cung cấp hoặc xác nhận. Đọc thêm tại Điều khoản Sử dụng.