OPEN-SOURCE SCRIPT
Volume Trend Analysis
Study Material for Volume Trend Analysis Dashboard
1. Introduction
This script is a complete volume-based technical analysis dashboard designed in TradingView, created under the guidelines of TradingView and aiTrendview. It combines multiple indicators—Volume, RSI, Supertrend, Buy/Sell Pressure, and Momentum—into a single visual dashboard.
The purpose is education and market observation, not guaranteed profits. Students using this tool should focus on understanding patterns, signals, and probabilities rather than treating them as fixed rules.
________________________________________
2. Core Components and Indicators
🔹 Volume Analysis
• Volume shows the number of shares/contracts traded in a specific period.
• The script compares today’s volume with historical averages (e.g., 20-day average).
• This helps identify whether trading activity is higher or lower than usual.
• Learning use: A student can track if high volume confirms a price breakout or if low volume suggests weak conviction.
• Combination:
o High price rise + High volume → Strong bullish move.
o Price rise + Low volume → Weak rally, may fail.
o Price fall + High volume → Strong selling pressure.
o Price fall + Low volume → Weak decline, may reverse.
________________________________________
🔹 RSI (Relative Strength Index)
• RSI measures momentum (0–100 scale).
• Above 70 = Overbought (possible selling zone).
• Below 30 = Oversold (possible buying zone).
• Around 50 = Neutral, sideways market.
• Learning use: Combine with volume—RSI near extremes with high volume often marks turning points.
• Combination:
o RSI < 30 + High buy pressure volume = Strong bounce probability.
o RSI > 70 + High sell pressure volume = Risk of reversal downward.
________________________________________
🔹 Supertrend
• Supertrend uses volatility (ATR) to show support/resistance bands.
• Price above = Bullish trend.
• Price below = Bearish trend.
• Learning use: New students can treat it as a dynamic stop-loss and trailing tool.
• Combination:
o Price > Supertrend + RSI > 50 + High buy volume = Safe bullish trend.
o Price < Supertrend + RSI < 50 + High sell volume = Safe bearish trend.
________________________________________
🔹 Buy/Sell Pressure
• The indicator splits volume into buying vs. selling portions based on price action.
• Shows % of buying volume vs. selling volume.
• Learning use: Students can visualize whether bulls or bears are dominating.
• Combination:
o Buying > 65% → Bulls stronger.
o Selling > 65% → Bears stronger.
o Balanced → Market indecisive (range-bound).
________________________________________
🔹 Momentum & Signal Status
• Momentum combines RSI and Supertrend to classify market as Bullish, Bearish, or Neutral.
• Buy/Sell signals are triggered on crossovers of price with Supertrend along with RSI conditions.
• Learning use: Beginners should not blindly trade these signals but track how often they succeed/fail under different market conditions.
• Combination:
o Bullish Momentum + Buy Signal + High Volume = Strong entry setup.
o Bearish Momentum + Sell Signal + High Volume = Strong short setup.
________________________________________
🔹 Volume Pace
• Compares current intraday volume with expected average progress.
• Above pace = Traders active earlier than usual.
• Below pace = Weak interest in current session.
• Learning use: Beginners can track whether moves are backed by real activity or just price manipulation.
• Combination:
o Above pace + Bullish signals = Reliable rally.
o Below pace + Bullish signals = Weak rally, avoid.
________________________________________
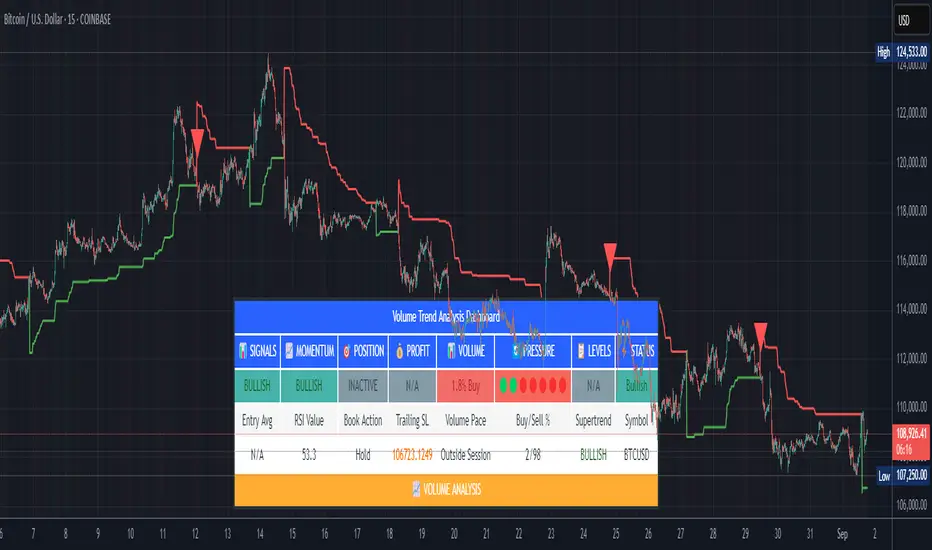
3. How to Use the Dashboard
• The dashboard consolidates all indicators into a simple table: Signals, Momentum, Position, Profit, Volume, Pressure, Levels, and Status.
• It helps beginners see different aspects of market condition at one glance.
• Instead of jumping between multiple charts, everything is available in one panel.
• Students can use this to practice observation, backtest signals, and record outcomes.
________________________________________
4. Educational Guidelines
1. Paper Trade First: Always test on virtual trading accounts before real money.
2. Record Outcomes: Note how each signal works in trending vs. sideways markets.
3. Combine with Chart Reading: This is not standalone—students must learn candlestick patterns, support/resistance, and fundamentals.
4. Avoid Overtrading: Just because a dashboard flashes “BUY” doesn’t mean to enter blindly.
5. Adapt Timeframes: Learn the difference between intraday vs. daily signals. Shorter timeframes = more noise.
________________________________________
5. Common Beginner Mistakes
• Blind Trading: Treating BUY/SELL signals as automatic entry/exit without analysis.
• Ignoring Volume: Not checking whether signals are backed by strong or weak volume.
• Overconfidence: Assuming 100% accuracy—no indicator is perfect.
• Misusing Alerts: Alerts help monitoring but don’t guarantee profitability.
________________________________________
6. Disclaimer
This indicator is created strictly for educational and learning purposes under TradingView and aiTrendview guidelines.
• It is not financial advice and should not be treated as a guaranteed profit-making tool.
• Past performance does not guarantee future results.
• Misuse of this indicator for blind speculation can result in financial loss.
• Always use it with proper risk management and independent judgment.
• For real trading decisions, consult a certified financial advisor.
________________________________________
✅ By studying this dashboard, students gain exposure to:
• How multiple indicators interact.
• How volume confirms or rejects price moves.
• How to build discipline by observing signals, not chasing them.
This makes the tool a training ground for market observation rather than a shortcut to quick profits.
1. Introduction
This script is a complete volume-based technical analysis dashboard designed in TradingView, created under the guidelines of TradingView and aiTrendview. It combines multiple indicators—Volume, RSI, Supertrend, Buy/Sell Pressure, and Momentum—into a single visual dashboard.
The purpose is education and market observation, not guaranteed profits. Students using this tool should focus on understanding patterns, signals, and probabilities rather than treating them as fixed rules.
________________________________________
2. Core Components and Indicators
🔹 Volume Analysis
• Volume shows the number of shares/contracts traded in a specific period.
• The script compares today’s volume with historical averages (e.g., 20-day average).
• This helps identify whether trading activity is higher or lower than usual.
• Learning use: A student can track if high volume confirms a price breakout or if low volume suggests weak conviction.
• Combination:
o High price rise + High volume → Strong bullish move.
o Price rise + Low volume → Weak rally, may fail.
o Price fall + High volume → Strong selling pressure.
o Price fall + Low volume → Weak decline, may reverse.
________________________________________
🔹 RSI (Relative Strength Index)
• RSI measures momentum (0–100 scale).
• Above 70 = Overbought (possible selling zone).
• Below 30 = Oversold (possible buying zone).
• Around 50 = Neutral, sideways market.
• Learning use: Combine with volume—RSI near extremes with high volume often marks turning points.
• Combination:
o RSI < 30 + High buy pressure volume = Strong bounce probability.
o RSI > 70 + High sell pressure volume = Risk of reversal downward.
________________________________________
🔹 Supertrend
• Supertrend uses volatility (ATR) to show support/resistance bands.
• Price above = Bullish trend.
• Price below = Bearish trend.
• Learning use: New students can treat it as a dynamic stop-loss and trailing tool.
• Combination:
o Price > Supertrend + RSI > 50 + High buy volume = Safe bullish trend.
o Price < Supertrend + RSI < 50 + High sell volume = Safe bearish trend.
________________________________________
🔹 Buy/Sell Pressure
• The indicator splits volume into buying vs. selling portions based on price action.
• Shows % of buying volume vs. selling volume.
• Learning use: Students can visualize whether bulls or bears are dominating.
• Combination:
o Buying > 65% → Bulls stronger.
o Selling > 65% → Bears stronger.
o Balanced → Market indecisive (range-bound).
________________________________________
🔹 Momentum & Signal Status
• Momentum combines RSI and Supertrend to classify market as Bullish, Bearish, or Neutral.
• Buy/Sell signals are triggered on crossovers of price with Supertrend along with RSI conditions.
• Learning use: Beginners should not blindly trade these signals but track how often they succeed/fail under different market conditions.
• Combination:
o Bullish Momentum + Buy Signal + High Volume = Strong entry setup.
o Bearish Momentum + Sell Signal + High Volume = Strong short setup.
________________________________________
🔹 Volume Pace
• Compares current intraday volume with expected average progress.
• Above pace = Traders active earlier than usual.
• Below pace = Weak interest in current session.
• Learning use: Beginners can track whether moves are backed by real activity or just price manipulation.
• Combination:
o Above pace + Bullish signals = Reliable rally.
o Below pace + Bullish signals = Weak rally, avoid.
________________________________________
3. How to Use the Dashboard
• The dashboard consolidates all indicators into a simple table: Signals, Momentum, Position, Profit, Volume, Pressure, Levels, and Status.
• It helps beginners see different aspects of market condition at one glance.
• Instead of jumping between multiple charts, everything is available in one panel.
• Students can use this to practice observation, backtest signals, and record outcomes.
________________________________________
4. Educational Guidelines
1. Paper Trade First: Always test on virtual trading accounts before real money.
2. Record Outcomes: Note how each signal works in trending vs. sideways markets.
3. Combine with Chart Reading: This is not standalone—students must learn candlestick patterns, support/resistance, and fundamentals.
4. Avoid Overtrading: Just because a dashboard flashes “BUY” doesn’t mean to enter blindly.
5. Adapt Timeframes: Learn the difference between intraday vs. daily signals. Shorter timeframes = more noise.
________________________________________
5. Common Beginner Mistakes
• Blind Trading: Treating BUY/SELL signals as automatic entry/exit without analysis.
• Ignoring Volume: Not checking whether signals are backed by strong or weak volume.
• Overconfidence: Assuming 100% accuracy—no indicator is perfect.
• Misusing Alerts: Alerts help monitoring but don’t guarantee profitability.
________________________________________
6. Disclaimer
This indicator is created strictly for educational and learning purposes under TradingView and aiTrendview guidelines.
• It is not financial advice and should not be treated as a guaranteed profit-making tool.
• Past performance does not guarantee future results.
• Misuse of this indicator for blind speculation can result in financial loss.
• Always use it with proper risk management and independent judgment.
• For real trading decisions, consult a certified financial advisor.
________________________________________
✅ By studying this dashboard, students gain exposure to:
• How multiple indicators interact.
• How volume confirms or rejects price moves.
• How to build discipline by observing signals, not chasing them.
This makes the tool a training ground for market observation rather than a shortcut to quick profits.
Mã nguồn mở
Theo đúng tinh thần TradingView, người tạo ra tập lệnh này đã biến tập lệnh thành mã nguồn mở để các nhà giao dịch có thể xem xét và xác minh công năng. Xin dành lời khen tặng cho tác giả! Mặc dù bạn có thể sử dụng miễn phí, nhưng lưu ý nếu đăng lại mã, bạn phải tuân theo Quy tắc nội bộ của chúng tôi.
Thông báo miễn trừ trách nhiệm
Thông tin và ấn phẩm không có nghĩa là và không cấu thành, tài chính, đầu tư, kinh doanh, hoặc các loại lời khuyên hoặc khuyến nghị khác được cung cấp hoặc xác nhận bởi TradingView. Đọc thêm trong Điều khoản sử dụng.