OPEN-SOURCE SCRIPT
Cập nhật 1-40-F&O EMA Screener
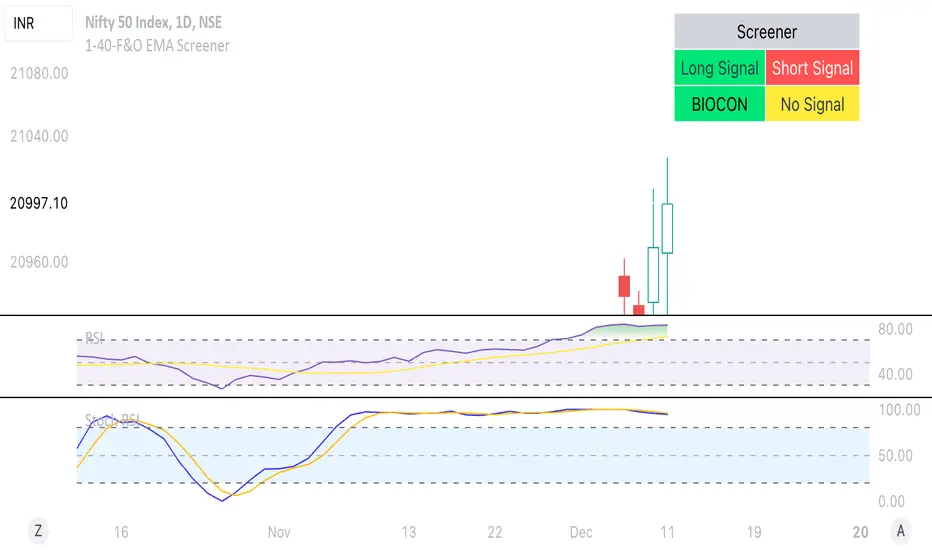
This Pine Script is a TradingView indicator named "1-40-F&O EMA Screener." It calculates and displays four moving averages (MA1, MA2, MA3, and MA4) and the Relative Strength Index (RSI) on a chart. The script generates buy and short signals based on certain conditions involving the moving averages and RSI. Additionally, it includes a screener section that displays a table of symbols with buy and short signals.
Here's a breakdown of the key components:
Moving Averages (MAs):
MA1: Simple Moving Average with length len1 (green line).
MA2: Simple Moving Average with length len2 (red line).
MA3: Simple Moving Average with length len3 (orange line).
MA4: Simple Moving Average with length len4 (black line).
Relative Strength Index (RSI):
The RSI is calculated with a length of rsiLengthInput and a source specified by rsiSourceInput.
Conditions for Buy and Short Signals:
Buy Signal: When MA1 is above MA2 and MA3, and RSI is above 50.
Short Signal: When MA1 is below MA2 and MA3, and RSI is below 50.
Signal Plots:
Buy signals are plotted as "B" below the corresponding bars.
Short signals are plotted as "S" above the corresponding bars.
Background Coloring:
Bars are colored based on their opening and closing prices.
Screener Section:
The script defines a watchlist (gticker) with 40 predefined symbols.
It then calls the getSignal function for each symbol to identify buy and short signals.
The results are displayed in a table with long signals in green and short signals in red.
Table Theming:
The script allows customization of the table's background, frame, and text colors, as well as the text size.
The table's location on the chart can also be customized.
Phát hành các Ghi chú
This Pine Script is a TradingView indicator named "1-40-F&O EMA Screener." It calculates and displays four moving averages (MA1, MA2, MA3, and MA4) and the Relative Strength Index (RSI) on a chart. The script generates buy and short signals based on certain conditions involving the moving averages and RSI. Additionally, it includes a screener section that displays a table of symbols with buy and short signals.Here's a breakdown of the key components:
Moving Averages (MAs):
MA1: Simple Moving Average with length len1 (green line).
MA2: Simple Moving Average with length len2 (red line).
MA3: Simple Moving Average with length len3 (orange line).
MA4: Simple Moving Average with length len4 (black line).
Relative Strength Index (RSI):
The RSI is calculated with a length of rsiLengthInput and a source specified by rsiSourceInput.
Conditions for Buy and Short Signals:
Buy Signal: When MA1 is above MA2 and MA3, and RSI is above 50.
Short Signal: When MA1 is below MA2 and MA3, and RSI is below 50.
Signal Plots:
Buy signals are plotted as "B" below the corresponding bars.
Short signals are plotted as "S" above the corresponding bars.
Background Coloring:
Bars are colored based on their opening and closing prices.
Screener Section:
The script defines a watchlist (gticker) with 40 predefined symbols.
It then calls the getSignal function for each symbol to identify buy and short signals.
The results are displayed in a table with long signals in green and short signals in red.
Table Theming:
The script allows customization of the table's background, frame, and text colors, as well as the text size.
The table's location on the chart can also be customized.
Mã nguồn mở
Theo đúng tinh thần TradingView, tác giả của tập lệnh này đã công bố nó dưới dạng mã nguồn mở, để các nhà giao dịch có thể xem xét và xác minh chức năng. Chúc mừng tác giả! Mặc dù bạn có thể sử dụng miễn phí, hãy nhớ rằng việc công bố lại mã phải tuân theo Nội quy.
Thông báo miễn trừ trách nhiệm
Thông tin và các ấn phẩm này không nhằm mục đích, và không cấu thành, lời khuyên hoặc khuyến nghị về tài chính, đầu tư, giao dịch hay các loại khác do TradingView cung cấp hoặc xác nhận. Đọc thêm tại Điều khoản Sử dụng.