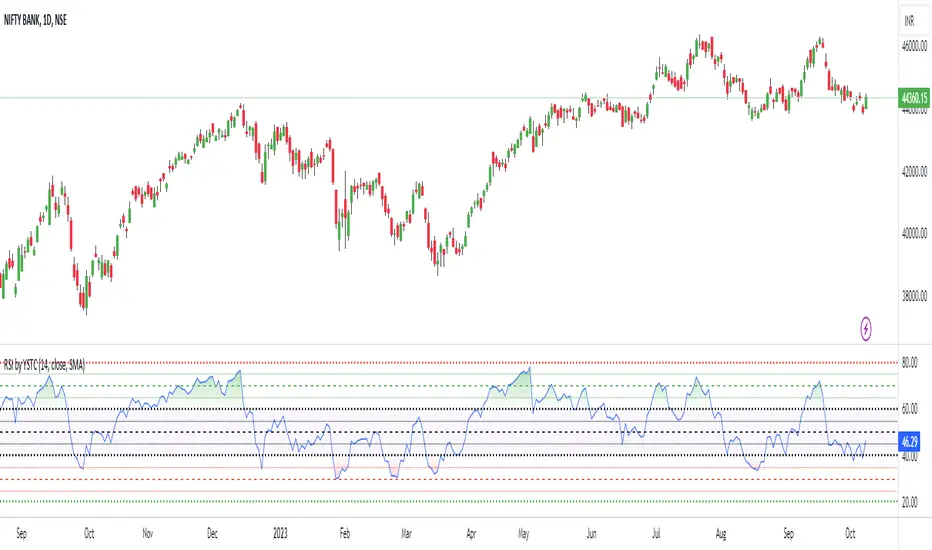
Relative Strength Index by YSTC
According to payment you will either get a TradingView account with indicators activated or
Have to send an email to contact@ystc.in with the email you used to sign up with us, and with your TradingView Username.
The script is available (for free) to YSTC's Course members of "Trading with PAV".
Relative Strength Index (RSI)
A momentum based oscillator which is used to measure the speed (velocity) as well as the change (magnitude) of directional price movements.
What Different about this RSI by YSTC.
You get Support and Resistance lines for RSI which are 20, 30, 40, 50, 60, 70, 80. as shown below.
It can also show RSI Candles as shown below.
For those who want all types of MA with MA Cross can play with this indicator. Below is MA Cross of 9, 21.
And for NEW user with untrained eyes who cant yet detect Divergence this indicator Saves you the trouble of finding.
Below is Regular Bullish and Bearish Divergence. Linewidth 2.
Below is Hidden Bullish and Bearish Divergence. Linewidth 1.
You can add this script to your chart by clicking "Add to favorite indicators" below.
Have Questions ?
contact@ystc.in
Free Stock Market Introduction Available.
Name: Yogesh Patil (YS Trading Coach).
Contact: +91 9637070868.
Time: Monday to Friday (10:00 AM - 07:00 PM).
Tập lệnh chỉ hiển thị cho người được mời
Chỉ những người dùng được tác giả chấp thuận mới có thể truy cập tập lệnh này. Bạn sẽ cần yêu cầu và được cấp quyền sử dụng. Thông thường quyền này được cấp sau khi thanh toán. Để biết thêm chi tiết, làm theo hướng dẫn của tác giả bên dưới hoặc liên hệ trực tiếp với YSTradingCoach.
Lưu ý rằng tập lệnh riêng tư này, chỉ dành cho người được mời, chưa được các quản trị viên tập lệnh xem xét, và việc tuân thủ Nội quy vẫn chưa được xác định. TradingView KHÔNG khuyến nghị bạn trả phí hoặc sử dụng một tập lệnh trừ khi bạn hoàn toàn tin tưởng vào tác giả và hiểu cách hoạt động của tập lệnh. Bạn cũng có thể tìm các lựa chọn miễn phí, mã nguồn mở trong các script cộng đồng của chúng tôi.
Hướng dẫn của tác giả
Thông báo miễn trừ trách nhiệm
Tập lệnh chỉ hiển thị cho người được mời
Chỉ những người dùng được tác giả chấp thuận mới có thể truy cập tập lệnh này. Bạn sẽ cần yêu cầu và được cấp quyền sử dụng. Thông thường quyền này được cấp sau khi thanh toán. Để biết thêm chi tiết, làm theo hướng dẫn của tác giả bên dưới hoặc liên hệ trực tiếp với YSTradingCoach.
Lưu ý rằng tập lệnh riêng tư này, chỉ dành cho người được mời, chưa được các quản trị viên tập lệnh xem xét, và việc tuân thủ Nội quy vẫn chưa được xác định. TradingView KHÔNG khuyến nghị bạn trả phí hoặc sử dụng một tập lệnh trừ khi bạn hoàn toàn tin tưởng vào tác giả và hiểu cách hoạt động của tập lệnh. Bạn cũng có thể tìm các lựa chọn miễn phí, mã nguồn mở trong các script cộng đồng của chúng tôi.