OPEN-SOURCE SCRIPT
true trend
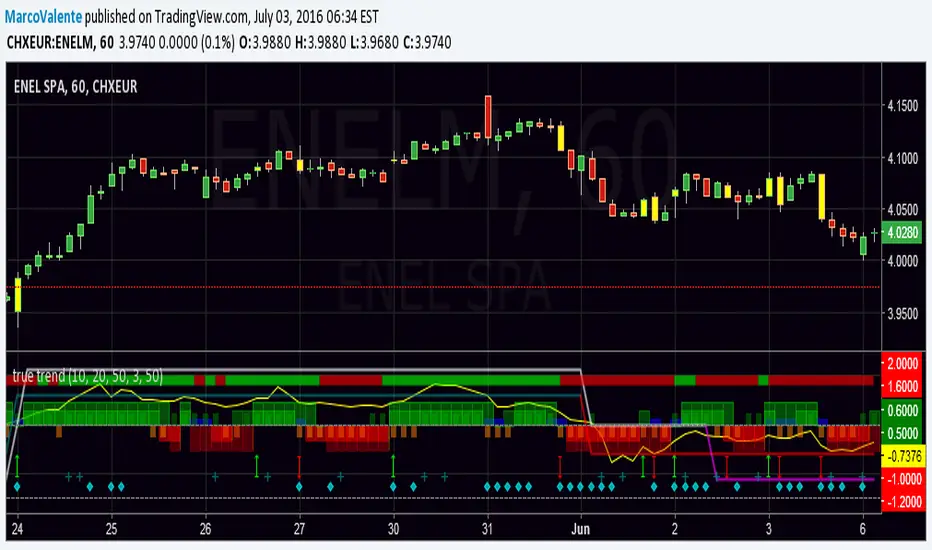
Easy way to look at the Trend , but still accurate. Top bar is DI +, DI - , bars change in yellow when a swing happen, histogram show the increase/decrease of Min and Max and Open-Close; 2 lines moving between +1 and - 1 folloiwng 3 Ema crossing ; a Dot (diamond shape) appear on the botton when volatility increase and finally a " + " show when volume are much bigger the usually. Yellow line on top is Willams % and help us to find top and bottom of the market.
Mã nguồn mở
Theo đúng tinh thần TradingView, tác giả của tập lệnh này đã công bố nó dưới dạng mã nguồn mở, để các nhà giao dịch có thể xem xét và xác minh chức năng. Chúc mừng tác giả! Mặc dù bạn có thể sử dụng miễn phí, hãy nhớ rằng việc công bố lại mã phải tuân theo Nội quy.
Thông báo miễn trừ trách nhiệm
Thông tin và các ấn phẩm này không nhằm mục đích, và không cấu thành, lời khuyên hoặc khuyến nghị về tài chính, đầu tư, giao dịch hay các loại khác do TradingView cung cấp hoặc xác nhận. Đọc thêm tại Điều khoản Sử dụng.