OPEN-SOURCE SCRIPT
Team Undergrounds Magic RSI Bands
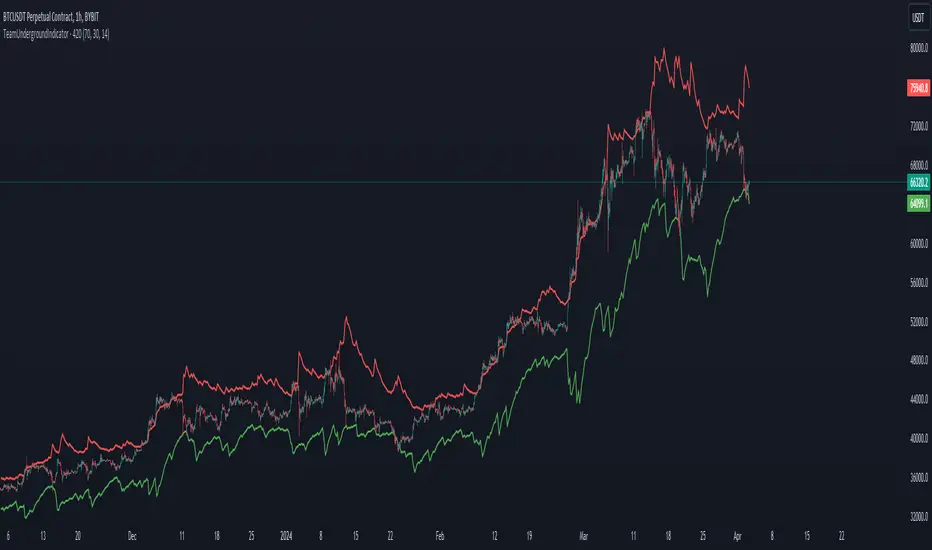
What is this indicator?
This indicator shows RSI but visualize as bands with custom timeframe settings. Normal RSI doesn't really visualse well when the price gets overbought/oversold and generally because of candle closes it can be hard to determine if the price has already touched the prefered RSI level. The custom timeframe allows you to go to shorter or longer timeframes on the chart while maintaining the same timeframe on the RSI indicator.
How does it work?
Add this indicator to the chart, and you'll see 2 bands (green and red). By standard settings, the green band shows when price goes below 30 RSI and the red line when price goes above 70 on the RSI. By standard settings the RSI band is set to 7 hour because this tends to work well with Bitcoin and crypto in general, but the timeframe can be changed in the settings. 12hr, 3hr, 3D, 1W are all good timeframes based off personal preference. The overbought/oversold level and RSI length can also be adjusted.
Indicator is not a financial advice tool, and offcourse, data can always change. Past price does not predict future price by defintion.
Mã nguồn mở
Theo đúng tinh thần TradingView, tác giả của tập lệnh này đã công bố nó dưới dạng mã nguồn mở, để các nhà giao dịch có thể xem xét và xác minh chức năng. Chúc mừng tác giả! Mặc dù bạn có thể sử dụng miễn phí, hãy nhớ rằng việc công bố lại mã phải tuân theo Nội quy.
Thông báo miễn trừ trách nhiệm
Thông tin và các ấn phẩm này không nhằm mục đích, và không cấu thành, lời khuyên hoặc khuyến nghị về tài chính, đầu tư, giao dịch hay các loại khác do TradingView cung cấp hoặc xác nhận. Đọc thêm tại Điều khoản Sử dụng.