OPEN-SOURCE SCRIPT
Background Trend Follower by exp3rts

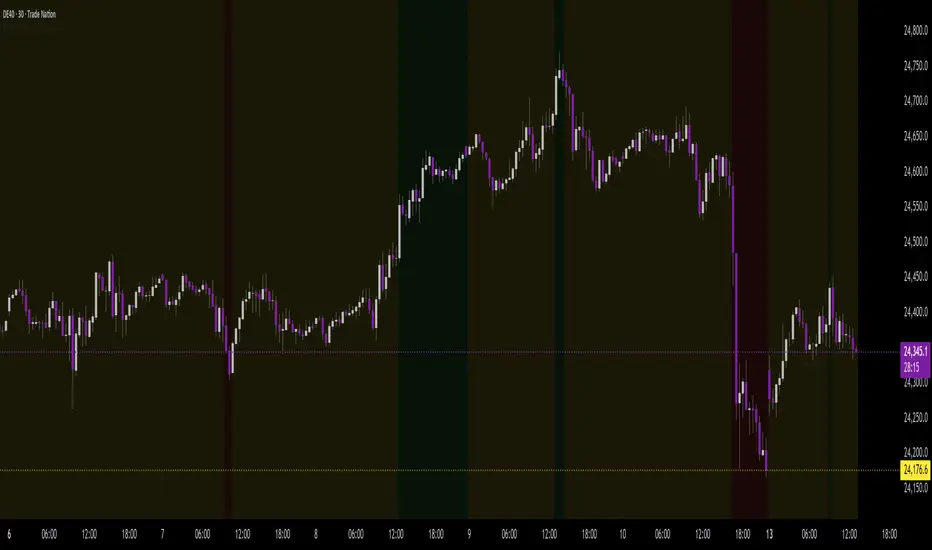
The Background Trend Follower indicator visually highlights the market’s daily directional bias using subtle background colors. It calculates the price change from the daily open and shades the chart background according to the current intraday momentum.
🟢 Green background → Price is significantly above the daily open (strong bullish trend)
🔴 Red background → Price is significantly below the daily open (strong bearish trend)
🟡 Yellow background → Price is trading near the daily open (neutral or consolidating phase)
Perfect for traders who want a quick visual sense of intraday bias — bullish, bearish, or neutral — without cluttering the chart with extra indicators.
🟢 Green background → Price is significantly above the daily open (strong bullish trend)
🔴 Red background → Price is significantly below the daily open (strong bearish trend)
🟡 Yellow background → Price is trading near the daily open (neutral or consolidating phase)
- The script automatically detects each new trading day.
- It records the opening price at the start of the day.
- As the session progresses, it continuously measures how far the current price has moved from that open.
- When the move exceeds ±50 points (custom threshold), the background color adapts to reflect the trend strength.
Perfect for traders who want a quick visual sense of intraday bias — bullish, bearish, or neutral — without cluttering the chart with extra indicators.
Mã nguồn mở
Theo đúng tinh thần TradingView, tác giả của tập lệnh này đã công bố nó dưới dạng mã nguồn mở, để các nhà giao dịch có thể xem xét và xác minh chức năng. Chúc mừng tác giả! Mặc dù bạn có thể sử dụng miễn phí, hãy nhớ rằng việc công bố lại mã phải tuân theo Nội quy.
Thông báo miễn trừ trách nhiệm
Thông tin và các ấn phẩm này không nhằm mục đích, và không cấu thành, lời khuyên hoặc khuyến nghị về tài chính, đầu tư, giao dịch hay các loại khác do TradingView cung cấp hoặc xác nhận. Đọc thêm tại Điều khoản Sử dụng.